As part of a management course I’m taking I learned more about the Hofstede model of Individualism and Collectivism. Individualistic societies, with the USA leading the way, tend to value individualism over the collective good. These tendencies have been discussed as impacting the success with which different countries could implement lockdowns and universal masking. As part of an exercise contrasting behaviors, I listed 14 countries from which I have had close friends.
I thought it would be interesting to compare these countries’ index of individualism (IDV) with their success in controlling deaths from Covid19. I removed Serbia and Croatia as they were significant outliers. In the remaining 12, there was a 78% correlation between total deaths per million people and the individualism score.
There is a lot of discussion about the extent to which cases of Covid-19 are being underreported due to mild cases and at-home antigen tests. Only lab-based tests are considered in official reporting. While there are many papers on the topic, and I have to dig deeper into those, I have not seen the Massachusetts data analyzed quantitatively, so I had a go at it. Please note this is a quick arm-chair pre-breakfast Excel analysis and not a vetted academic study. Inferences about the data are speculative.
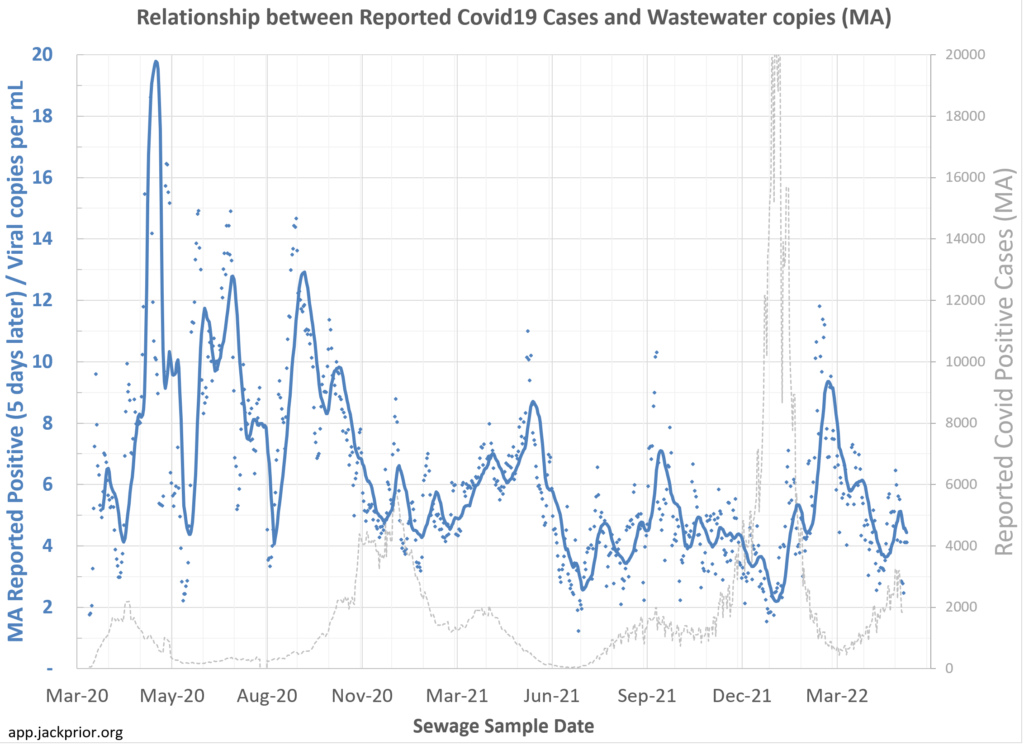
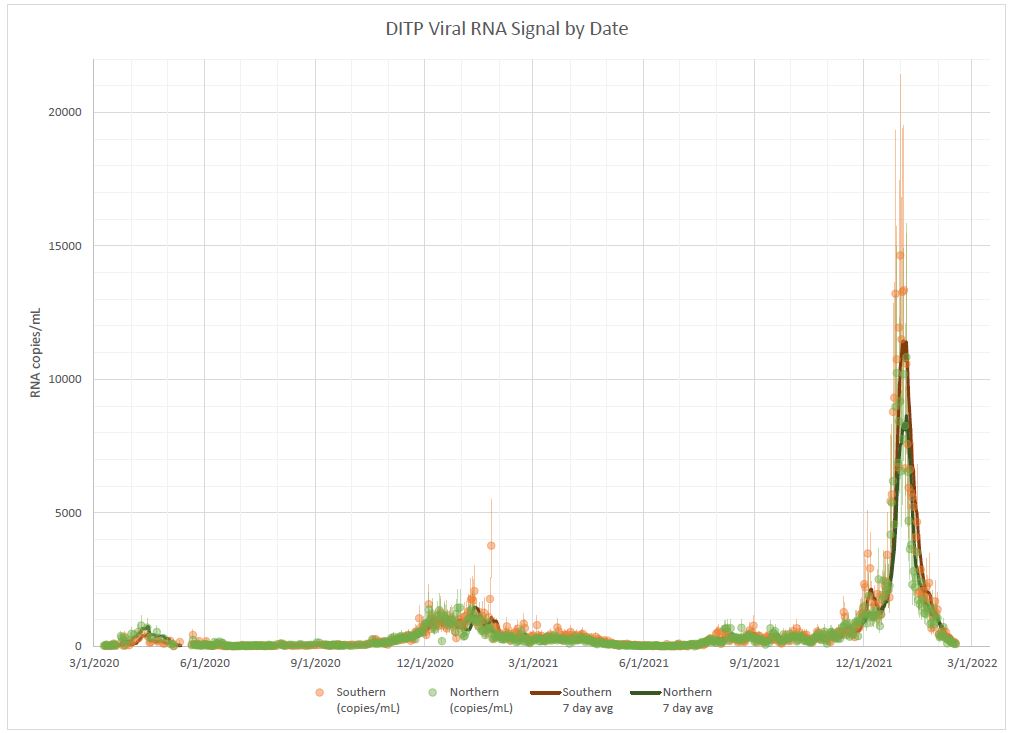
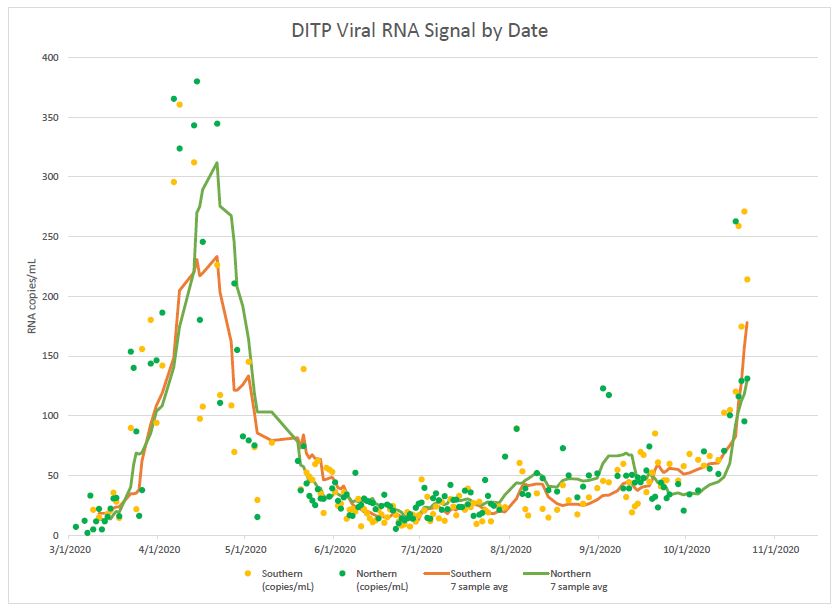
I downloaded the wastewater data reported by MWR and the reported cases from app.jackprior.org to see what the pattern is in the ratio of the two reported results. To smooth out the wastewater data I averaged the northern and southern data, filled the gaps, and then looked at 7-day averages. I shifted the case data back 5 days as that has been reported as the typical lag from wastewater signals to reported cases.
The data in blue is the number of reported cases in MA per day over time (shifted by 5 days to line up with wastewater data) divided by the copies per mL reported in the wastewater. The line is a 14-day moving average of the ratio. The data in gray is the total number of cases officially reported in MA.
So what does it say? Overall I would say the patterns are not as clear as people have described anecdotally.
Some of the unknowns and confounding factors:
There is no particular moment that we can say that all, or nearly all, cases were being reported.
We also don’t know the extent to which viral shedding per infected person varies by variant or the impact of vaccination on the degree of shedding.
Wastewater only covers about one third of MA residents and is concentrated on eastern portion of stat.
At the moment Massachusetts is reporting about 4000 cases per day, and the wastewater has about 1000 copies per mL, so a ratio of around 4.
The case to virus concentration ratio peaked at 20 in mid-May 2020 and dipped as low as 2 at the height of the holiday Omicron variant wave in early January 2022. In mid-May 2020 our testing infrastructure was still constrained so even the 20 ratios likely reflect some underreporting even then.
The ratio approaching 2 in early January would suggest we may have been seeing only 10% of the actual cases reported in that post-holiday peak.
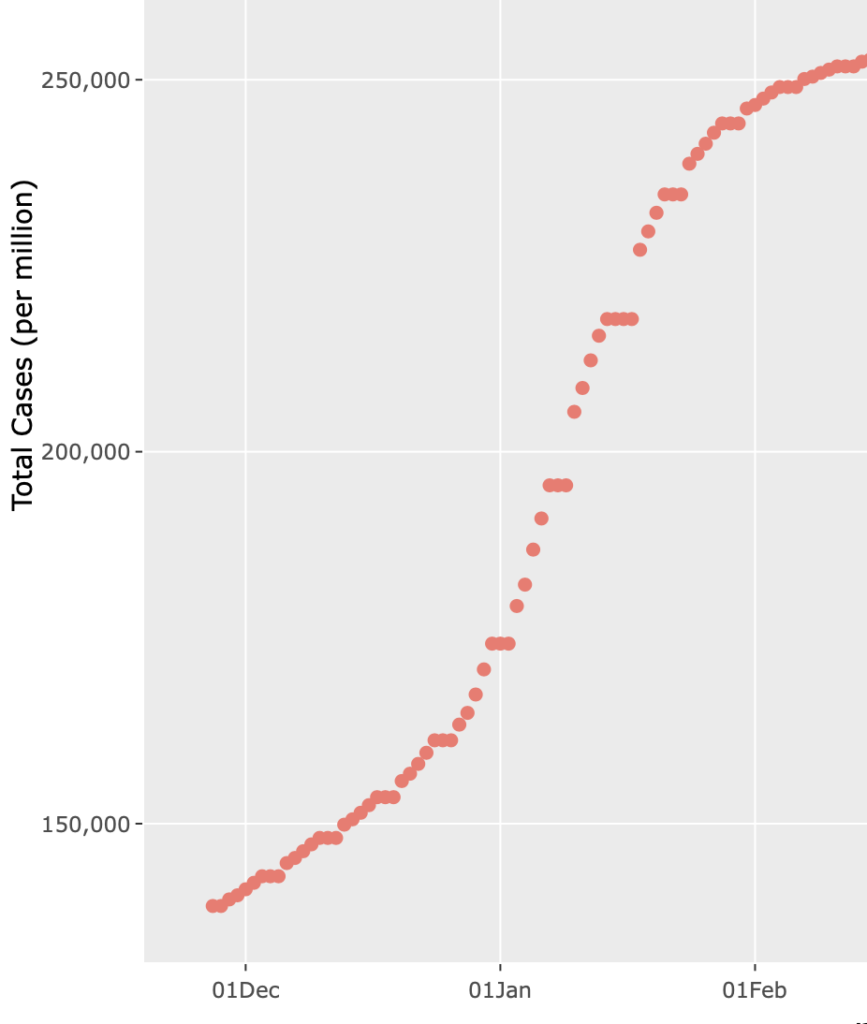
Now, the Dec-Jan period saw over 1 in 10 MA residents officially reported as infected, so 10% would mean everyone got infected, which is not realistic. So other factors are involved.
Interestingly though, as cases subsided in February, the ratio rose to near 10, suggesting as many as 50% of cases may have been detected.
The general pattern seems to be that there is a baseline of easily available and routine testing in normal settings (e.g. in pre-surgery tests), but as actual cases surge in the population, the more marginal cases are missed either due to mild symptoms or increased difficulty in obtaining an official test.
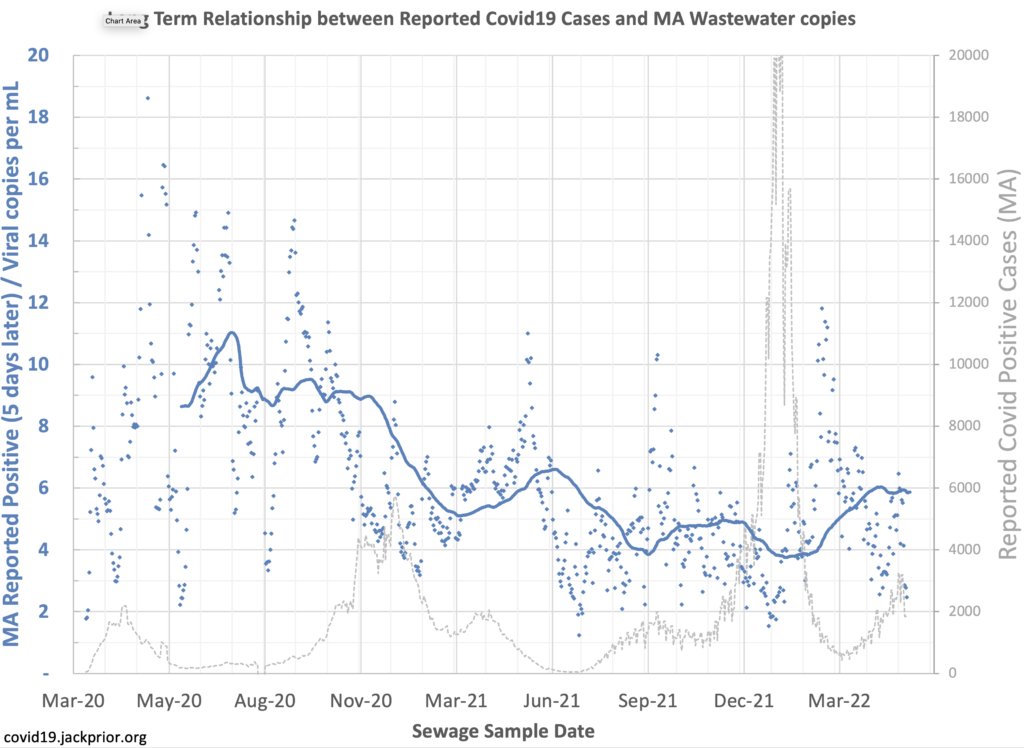
Looking at the longer-term moving average of the ratio over 3-month periods, the general pattern in the ratio seems to be roughly 9 in the pre-vaccination period dipping to roughly 6 in early 2021 and then 4-5 in late 2021, with a current average of around 6.
The interesting next step in this analysis would be to see if the estimated true cases line up with reported antibody results for the population over time.
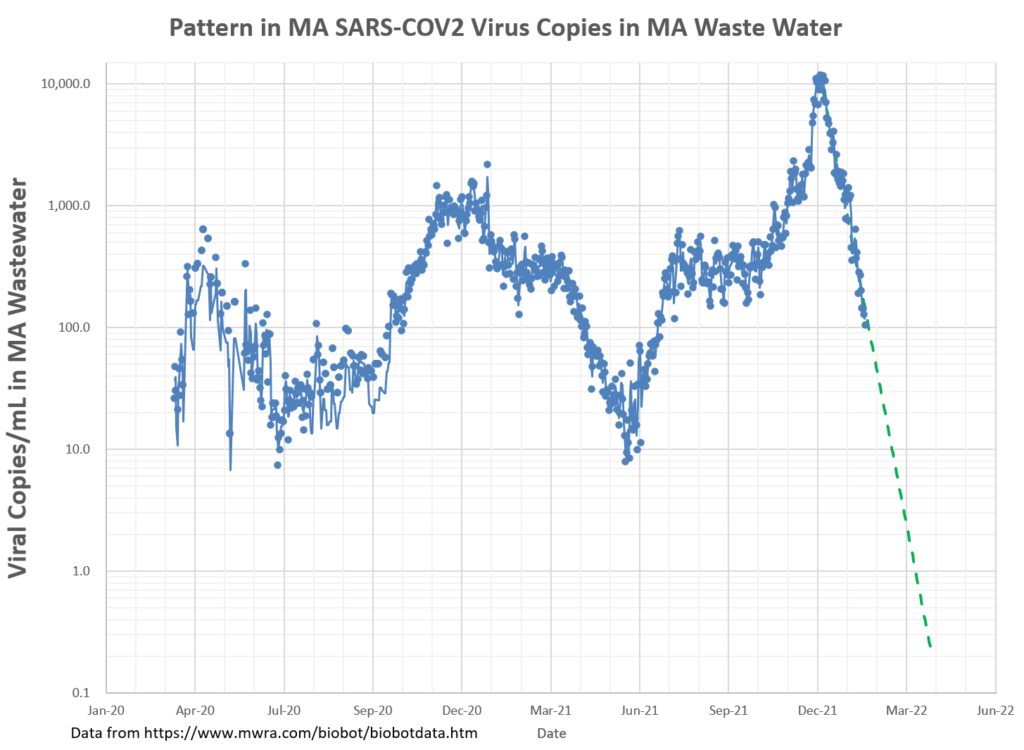
The reduction in MA wastewater Covid19 is easier to see on a log scale. Things are 100x better than on 3Jan peak, steadily dropping 9.6% every day. Levels could hit a record low by 20Mar if the trend continues. It will likely slow with reopenings. Data from https://www.mwra.com/biobot/biobotdata.htm
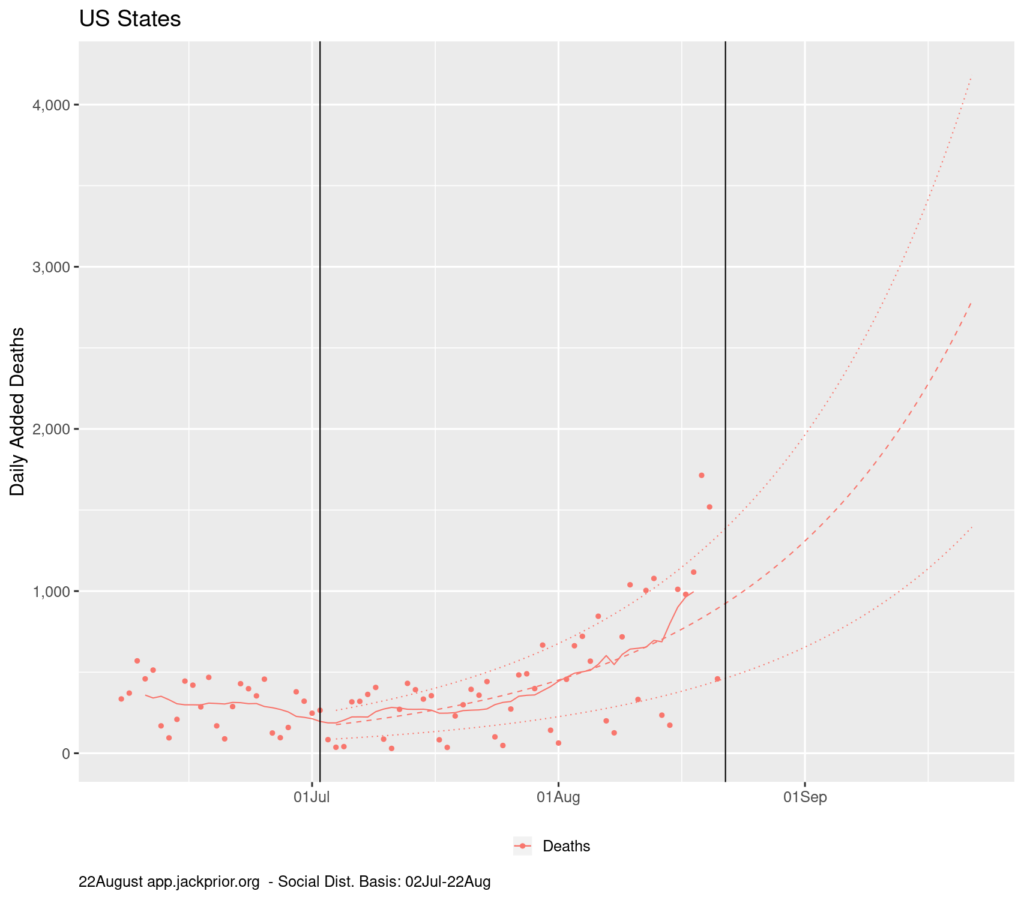
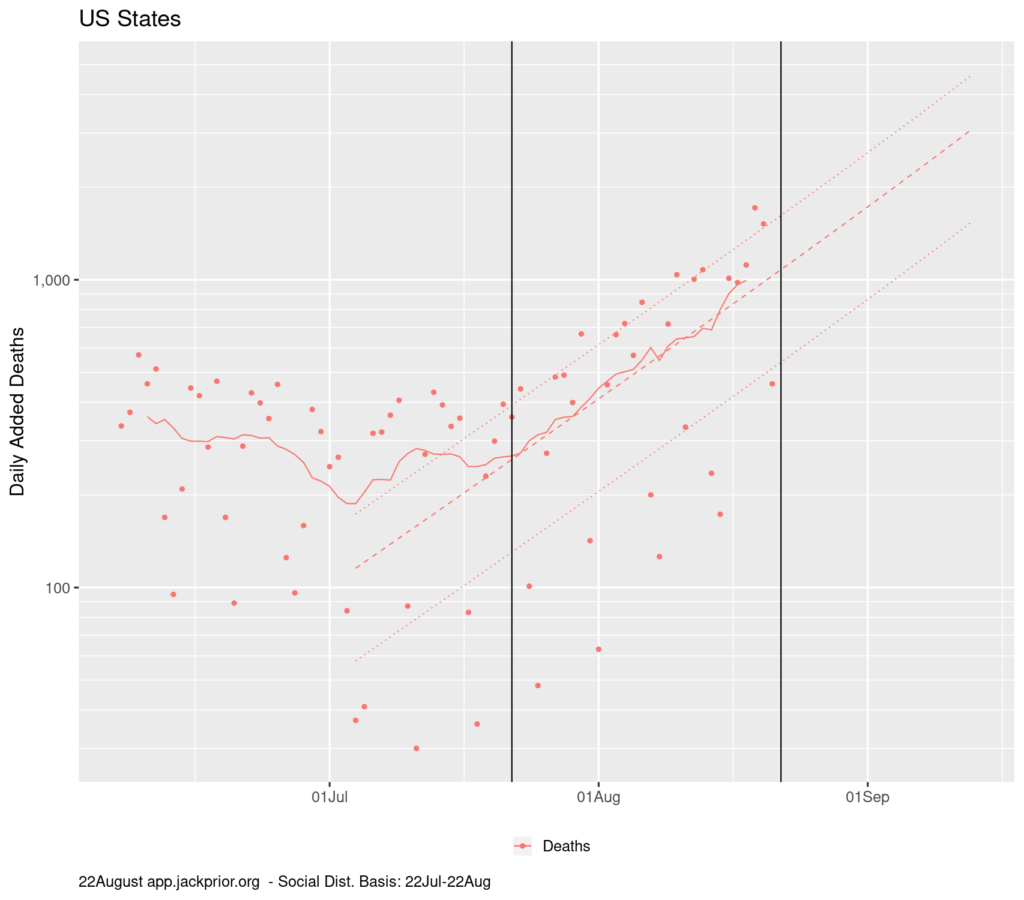
Right now deaths are averaging about a 1000/day. Deaths have been doubling every 2 weeks (5%/day growth rate) for a month. If this trend continues, that will put the USA at nearly 3000 deaths per day on September 11th.
Massachusetts deaths have been doubling every 3.3 weeks (3%/day) from a lower starting point per capita. Masssacusetts contribution to that US total could be an average of less than 15/day due to its USA leading vaccination rate and voluntary/required masking practices.
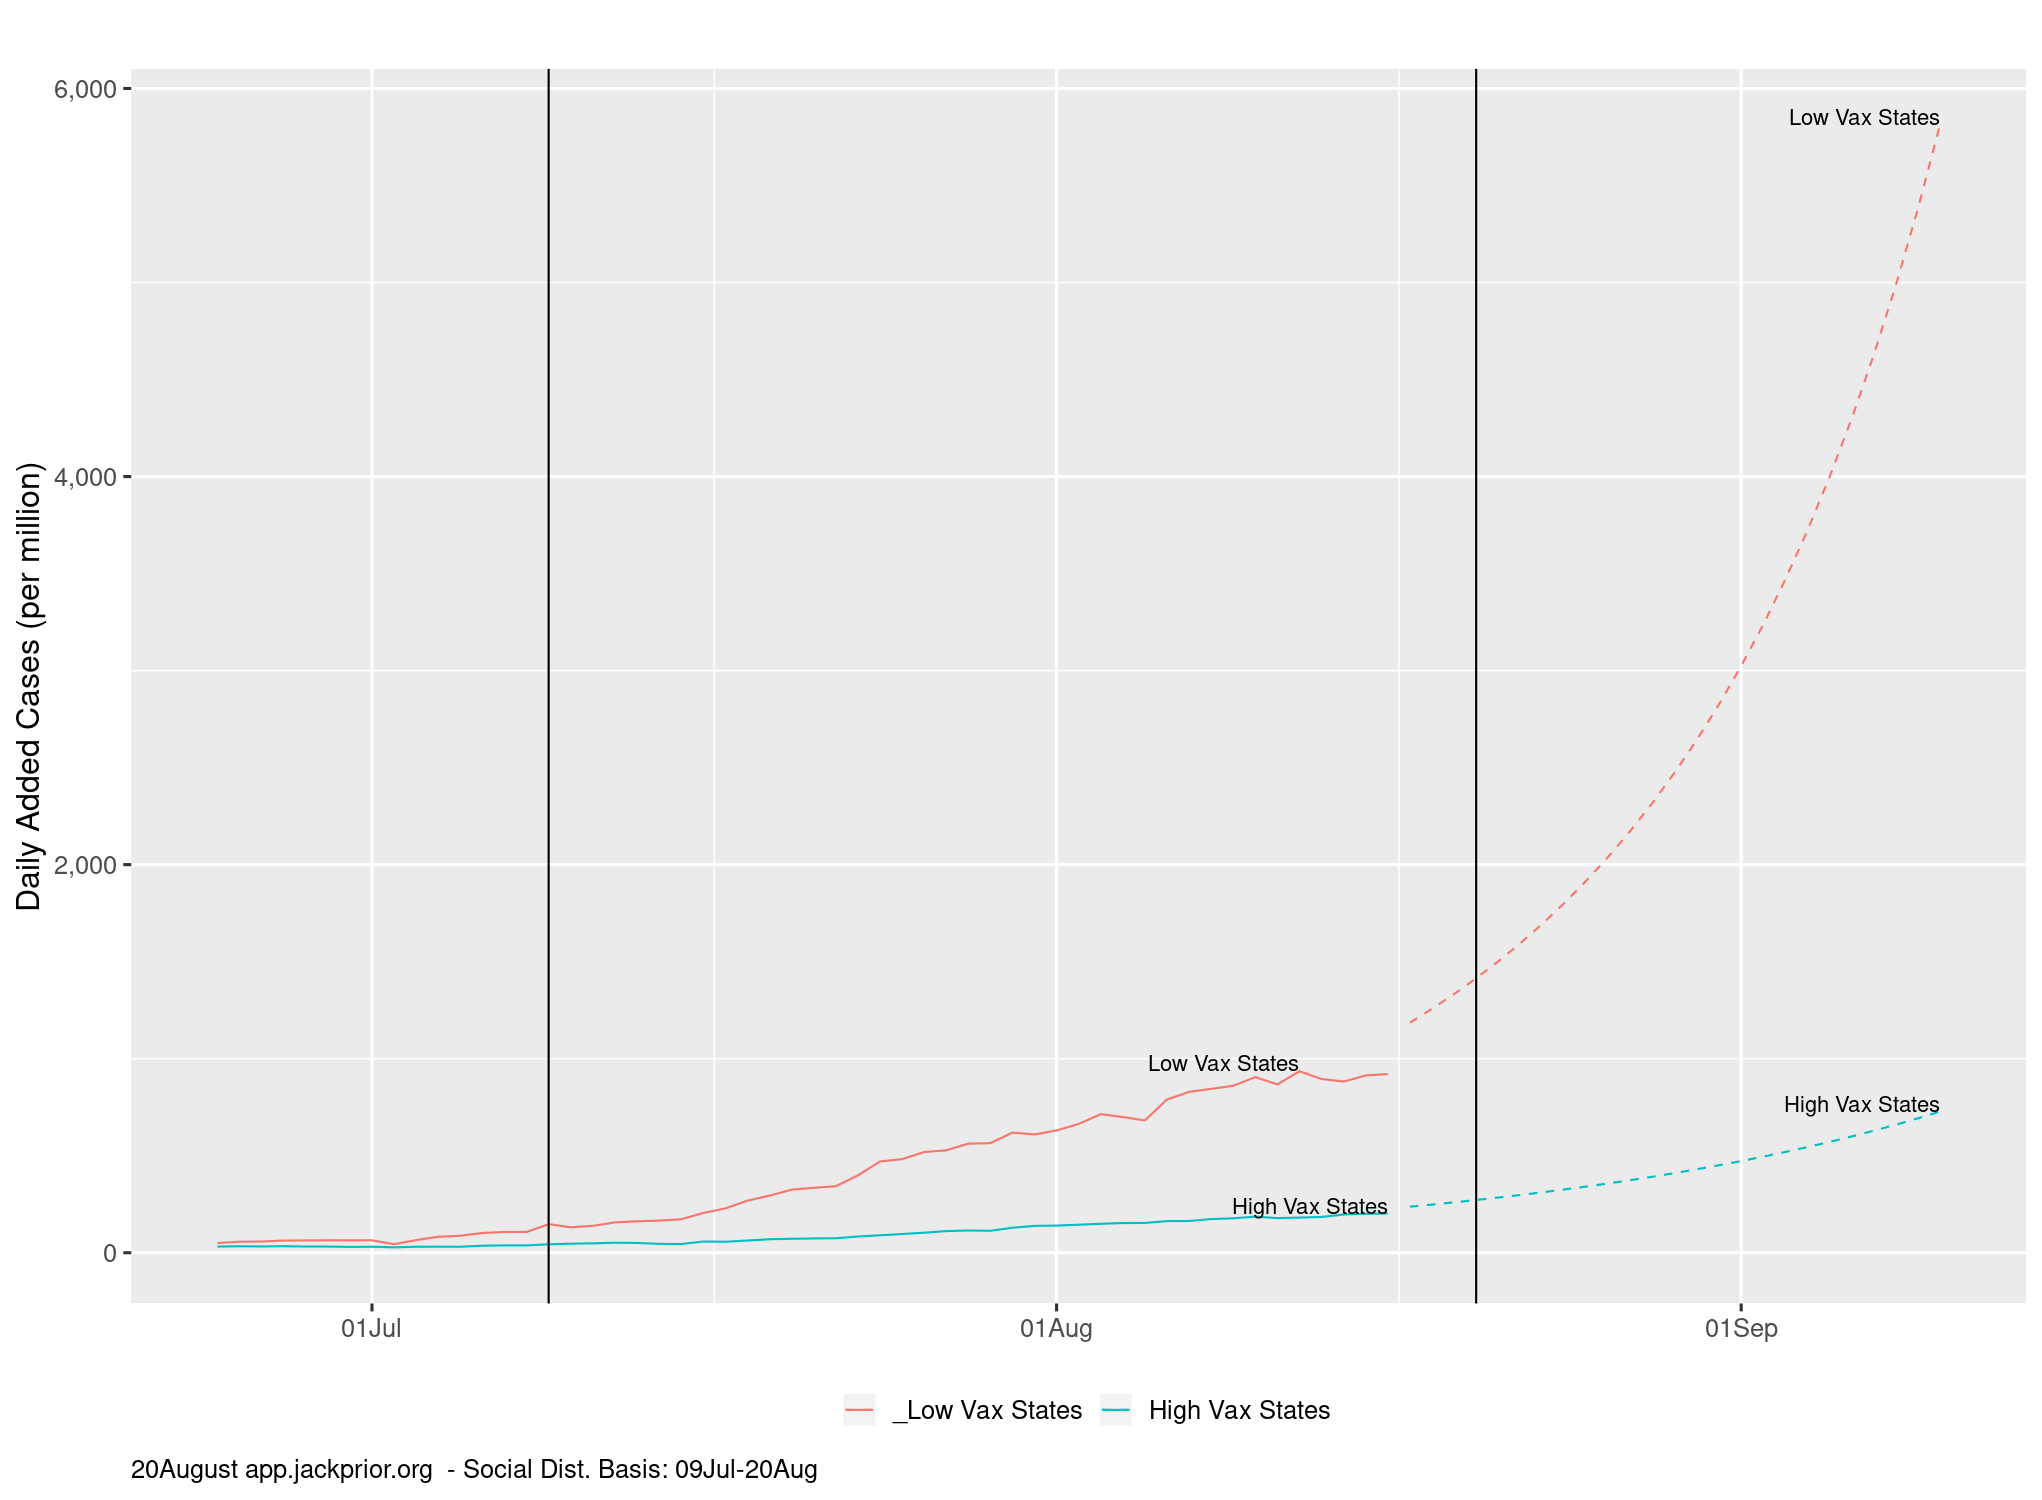
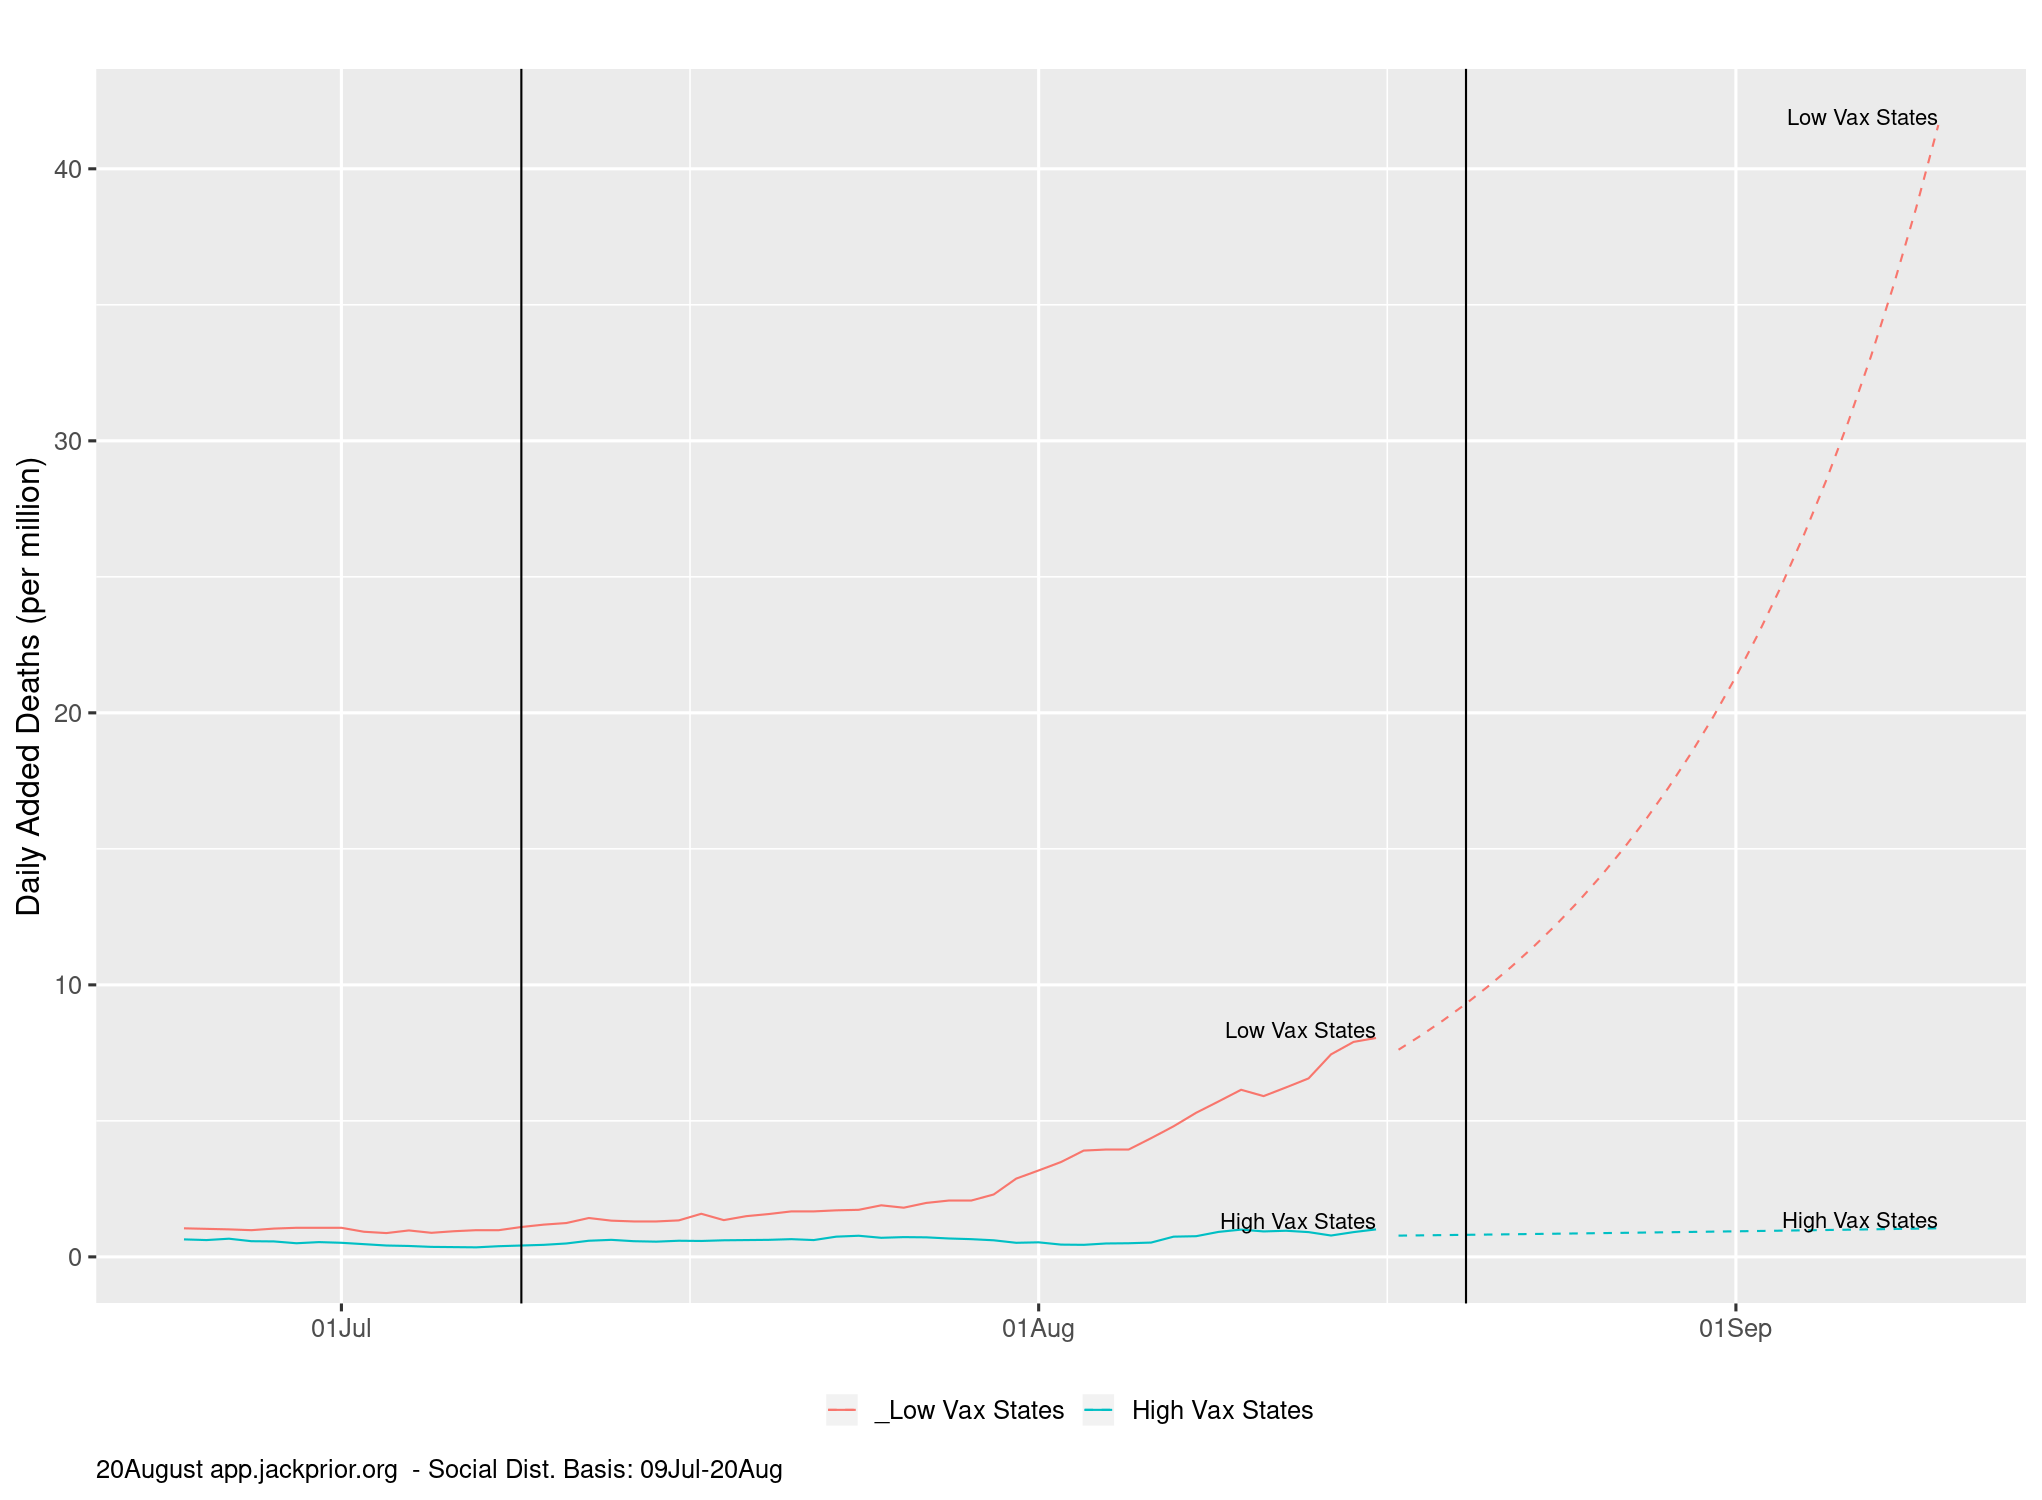
People probably have a qualitative sense of how things are playing out with the current Delta surge in states with high and low vaccination rates, but it is instructive to look at the trends. The app.jackprior.org Covid-19 trending app now has two groups defined (high and low vaccination rate states) to illustrate this.
Here is the current per-capita ranking of states based on full vaccination. They range from about 37% for MS to 67% for MA.
Combining the top five and bottom five states into two groups -shows they average ~39% for the low vaccination group of states and ~63% for the high vaccination group.
So how are these sets of states fairing in the current Delta surge that began around June 23rd?
Cases are running higher and rising faster in the low vaccination states:
Daily deaths are high and rising in low vaccination states while they are trending flat in high vaccination states.
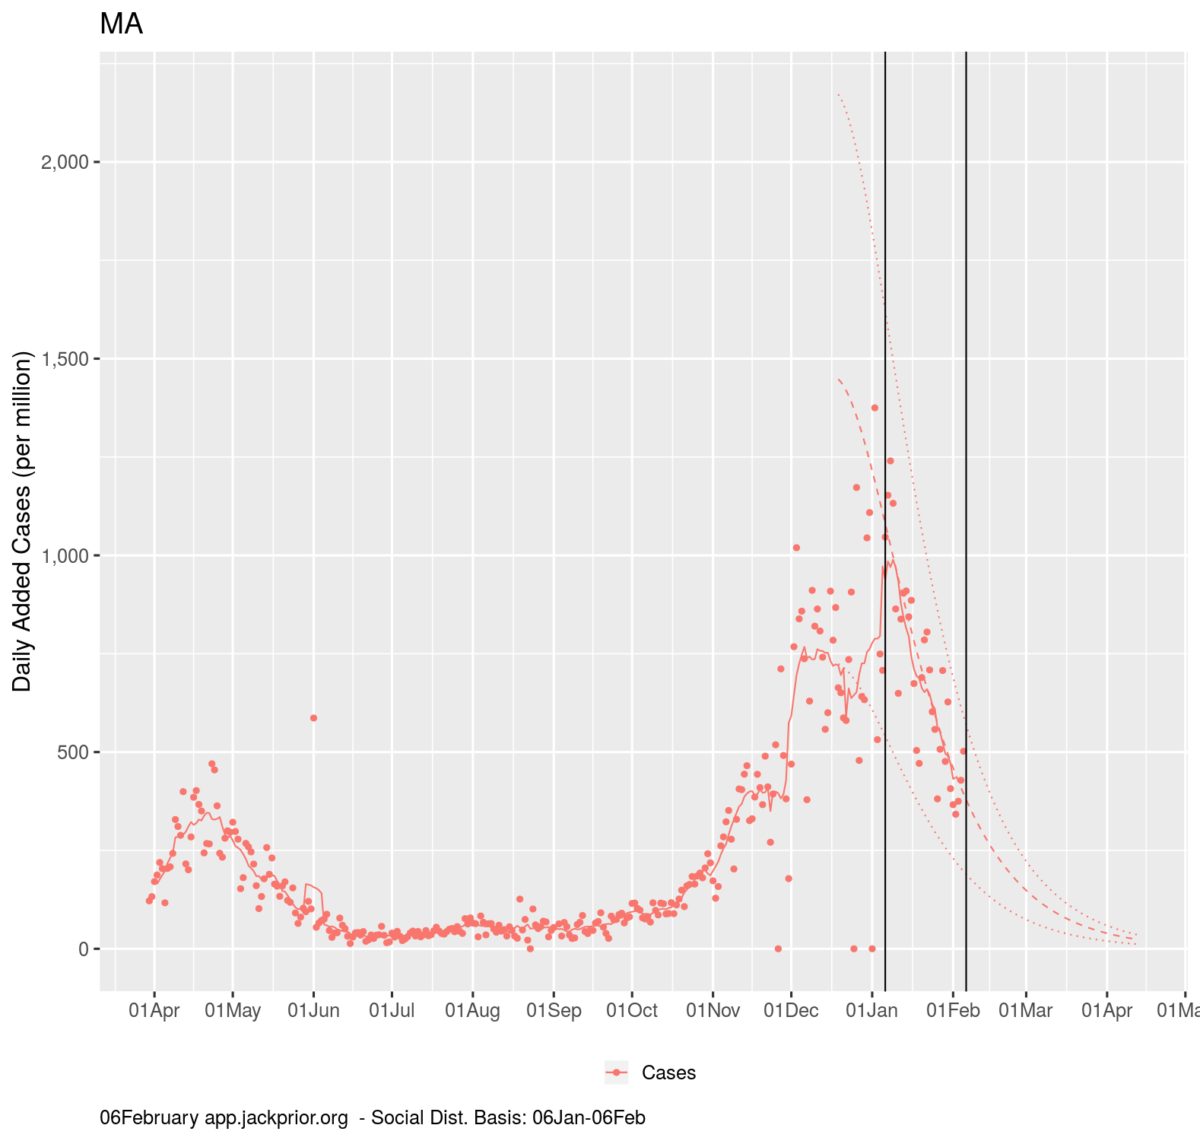
After heading in the wrong direction since mid June, Massachusetts began flattening the curve again on January 6th, with case growth steadily dropping at rate of -4.4%/day for the last 30 days. When the case growth rate is negative, this roughly corresponds to an R0 less than 1.
This is only slightly slower than the -5.7% rate that Massachusetts flattened the curve in the spring, despite a much more open economy and schools. You can see in plot below that MA lost its momentum in mid June due to reopening or other factors.
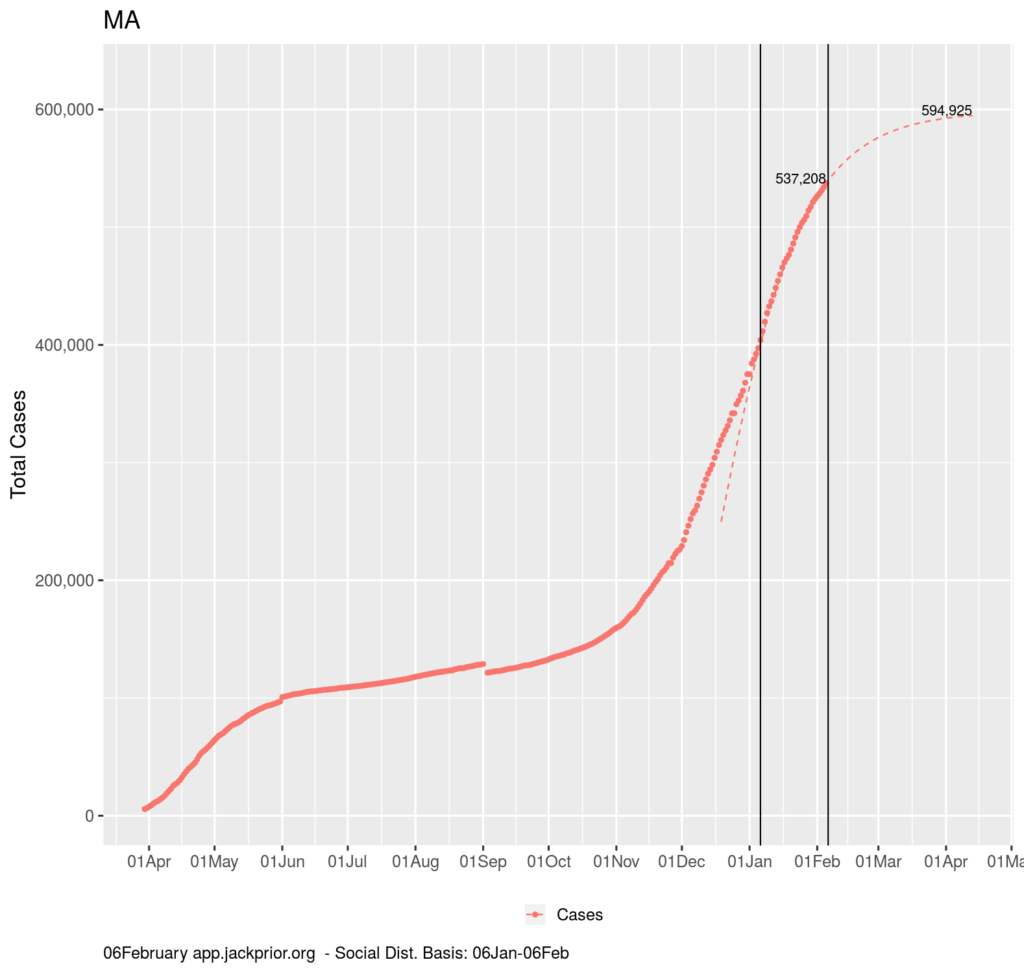
If we can sustain the current rate of flattening, Massachusetts could be down to less than 35 new cases per day per million residents state-wide from the peak that averaged 1000/million/day. This would make it 28 times less likely we would be unknowingly running into someone with Covid19. The challenge for the state is balancing this goal with the need to reopen the economy as much as possible to sustain local businesses and employment. Eventually, even if Massachusetts sustained its current trend, travel from other more infected states would start to limit the infection reduction achievable.
That could translate to about 60,000 more cases between now and April 15, which would roughly translate to 1200 more deaths state wide on top of our current 14.8K if the observed case fatality rate stayed around 2%
The App now include data on the number of people partially and fully vaccinated. Massachusetts is now at the point of having vaccinated roughly the same number of people that are known to have been infected (about 7% each). Assuming no overlap, that would amount to roughly 14% of the state’s population being protected from severe illness.
The forecasts above do not account for any accelerating benefit of vaccination, so there may be some further infection reduction to be achieved above this pace if the the vaccination role out can be sustained or accelerated.
The app.jackprior.org app now allows you to select more than one state/country for its plots.
On NPR “Up First” podcast this morning, Jason Beaubien noted that “there are some trends emerging in the types of governments best able to respond to this. If you look at the countries having the toughest time they have some similarities.”
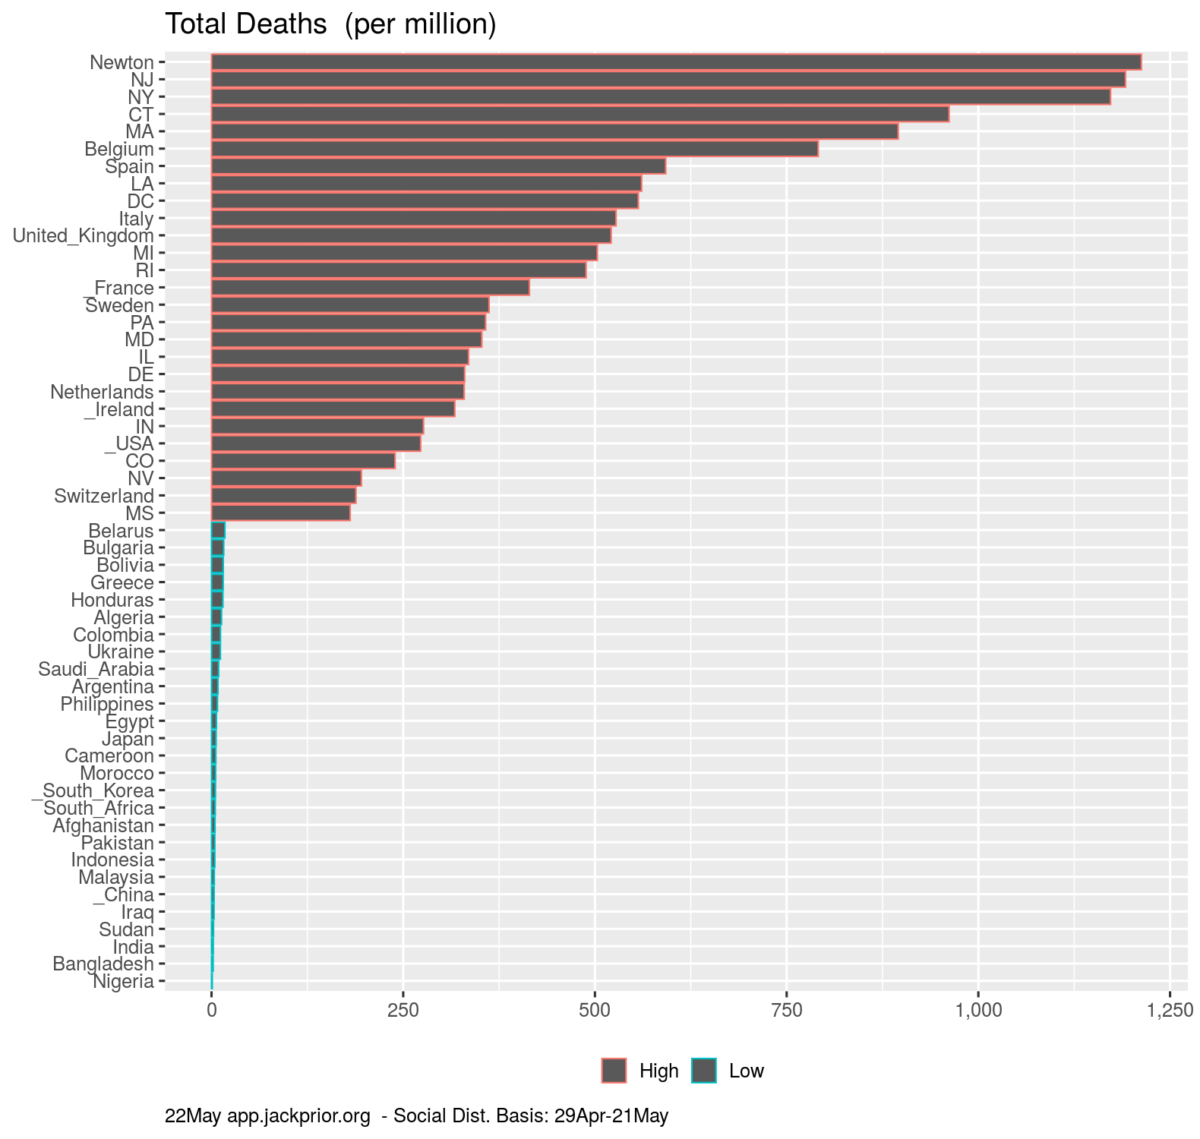
Newton has 710 cases and is forecast to have another 20 to 730. It has 105 deaths and is forecast to have another 25 to 130. The new totals do not reflect a surge in cases but instead reflect cases with initial symptoms several weeks back with delayed reporting.
On a per-capita basis (assuming an approximate population of 85,000), Newton has had 1235 deaths per million residents. That ranks higher than all other countries and US states and ahead of NJ and NY.