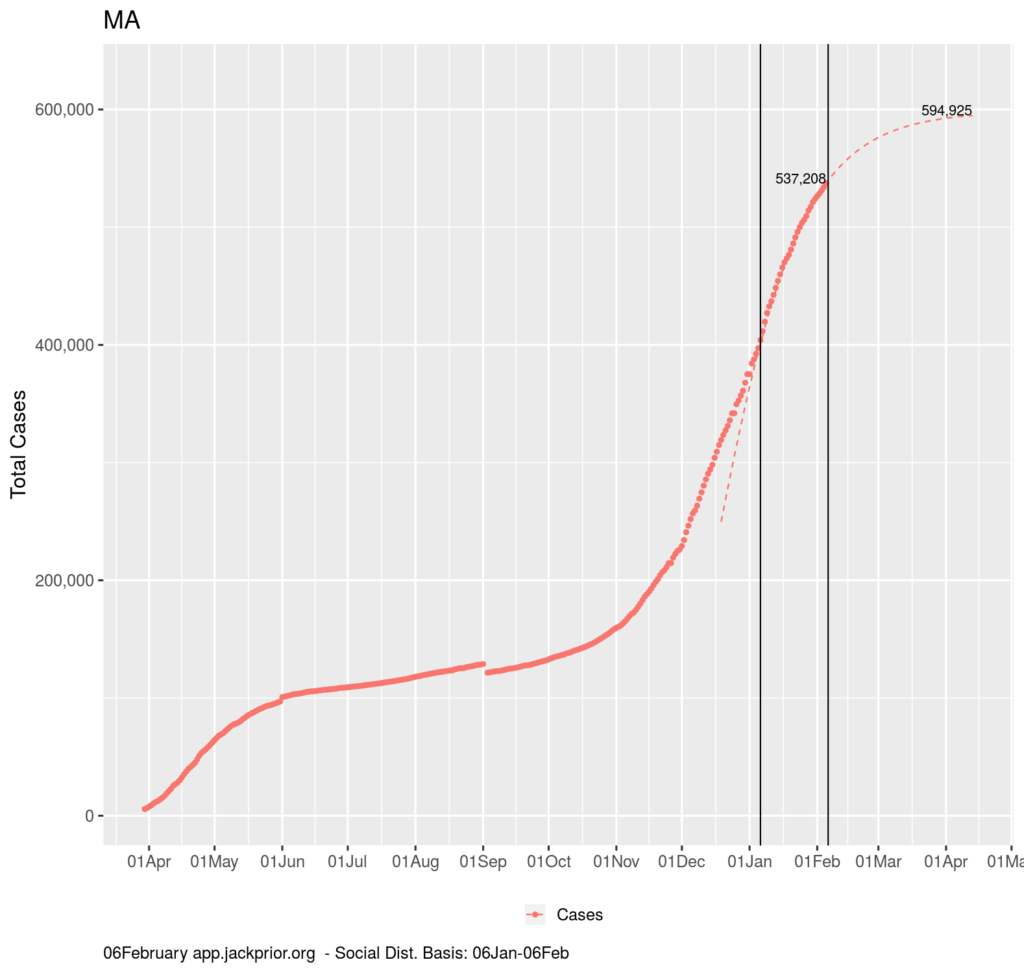
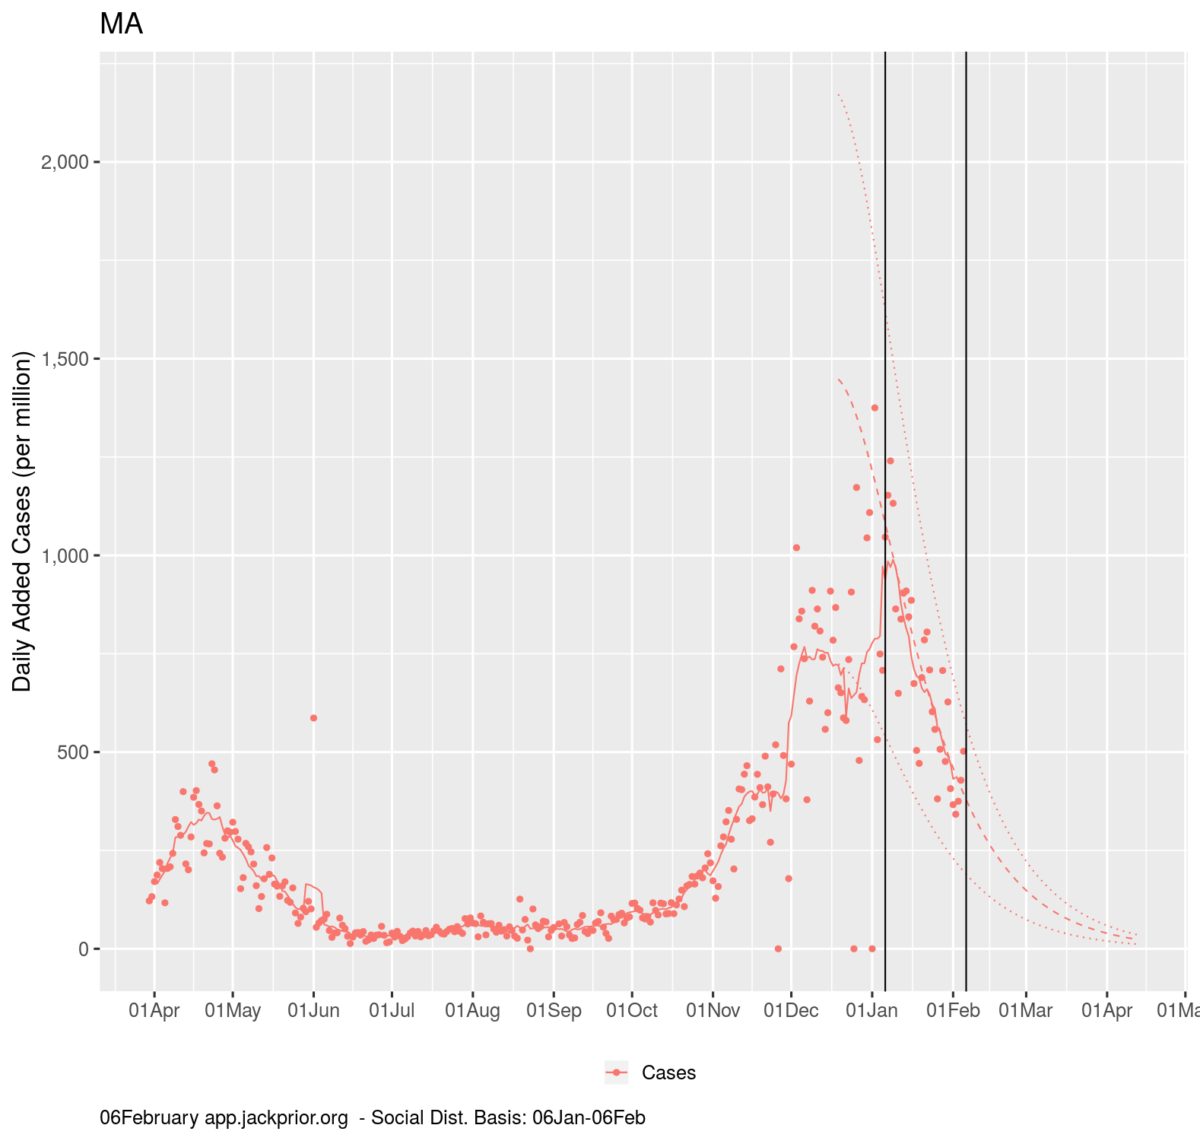
After heading in the wrong direction since mid June, Massachusetts began flattening the curve again on January 6th, with case growth steadily dropping at rate of -4.4%/day for the last 30 days. When the case growth rate is negative, this roughly corresponds to an R0 less than 1.

This is only slightly slower than the -5.7% rate that Massachusetts flattened the curve in the spring, despite a much more open economy and schools. You can see in plot below that MA lost its momentum in mid June due to reopening or other factors.

If we can sustain the current rate of flattening, Massachusetts could be down to less than 35 new cases per day per million residents state-wide from the peak that averaged 1000/million/day. This would make it 28 times less likely we would be unknowingly running into someone with Covid19. The challenge for the state is balancing this goal with the need to reopen the economy as much as possible to sustain local businesses and employment. Eventually, even if Massachusetts sustained its current trend, travel from other more infected states would start to limit the infection reduction achievable.

That could translate to about 60,000 more cases between now and April 15, which would roughly translate to 1200 more deaths state wide on top of our current 14.8K if the observed case fatality rate stayed around 2%

The App now include data on the number of people partially and fully vaccinated. Massachusetts is now at the point of having vaccinated roughly the same number of people that are known to have been infected (about 7% each). Assuming no overlap, that would amount to roughly 14% of the state’s population being protected from severe illness.

The forecasts above do not account for any accelerating benefit of vaccination, so there may be some further infection reduction to be achieved above this pace if the the vaccination role out can be sustained or accelerated.
