The Mayor’s office updated the way it reports data to track it back to the date of initial symptoms rather than when the case was confirmed. Previously case reports had gaps and jumped up intermittently. This data also gives detailed daily data going back to the 1st reported case on 2/28.
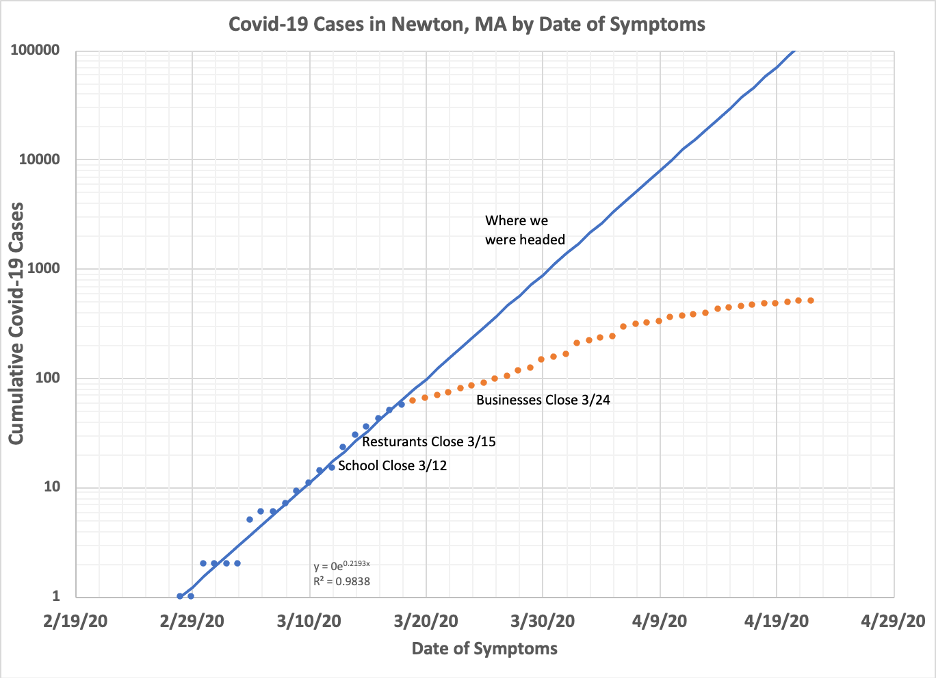
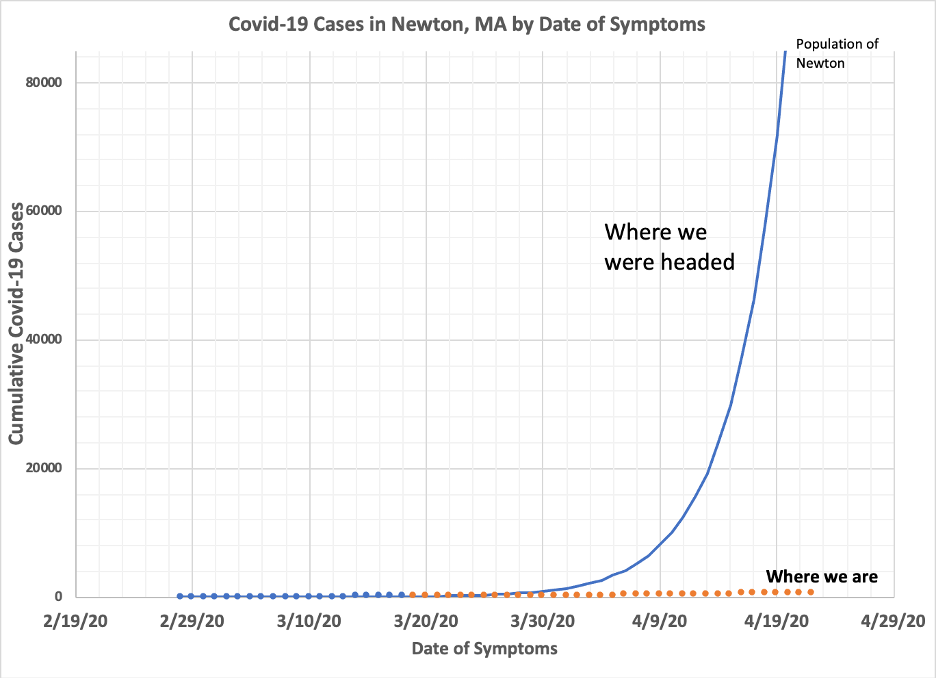
The data shows the virus spread steadily in the first two weeks, doubling every 3.5 days until the impact of school closings started to bend the curve after 62 infections. If we had not implemented any distancing, the entire city would be infected by now.
Using a log scale compresses things and allows the constant exponential growth of the early epidemic to be visualized, but it doesn’t fully capture the impact of social distancing. Here is a linear comparison of where we were headed (blue line) and were we are (orange points):
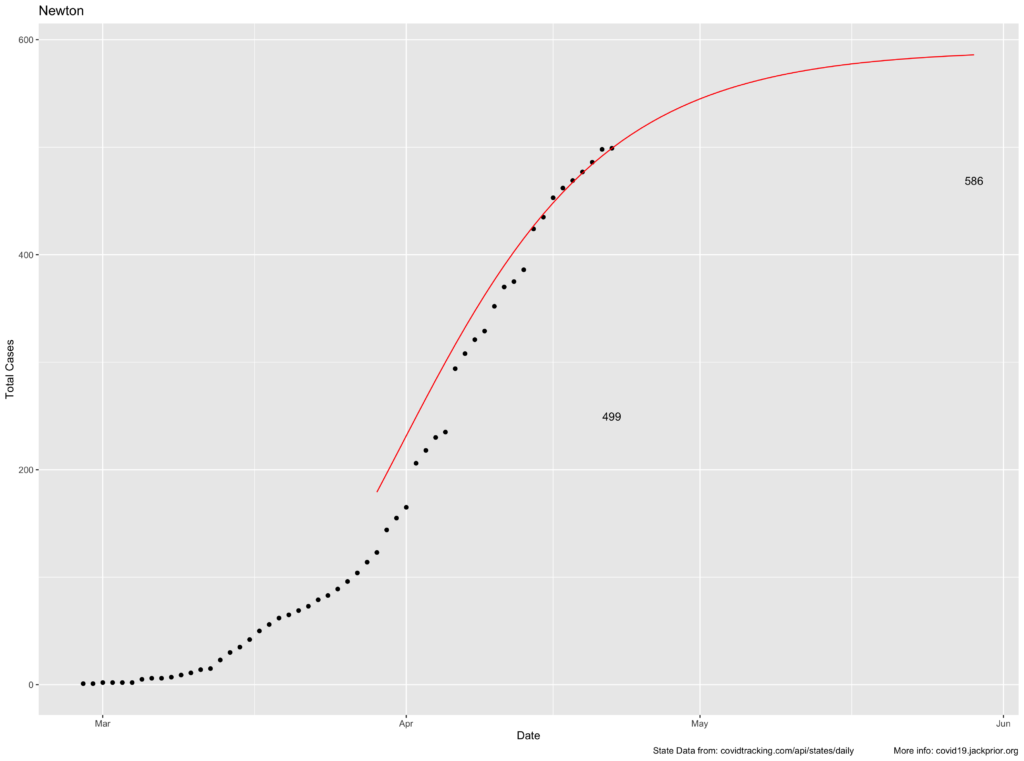
We are currently trending toward having another 100 cases added to our current 499 between now and the end of May. Note that cases and deaths are still generally being underreported in the state.
Sadly, the city has experienced 58 deaths to date; 13% of these reported cases. Nursing homes have been particularly hard hit constituting nearly half the reported cases.
Based on Massachusett current Case Fatality rate of ~5%, I would estimate state-wide the actual infections are ~15X the reported values.
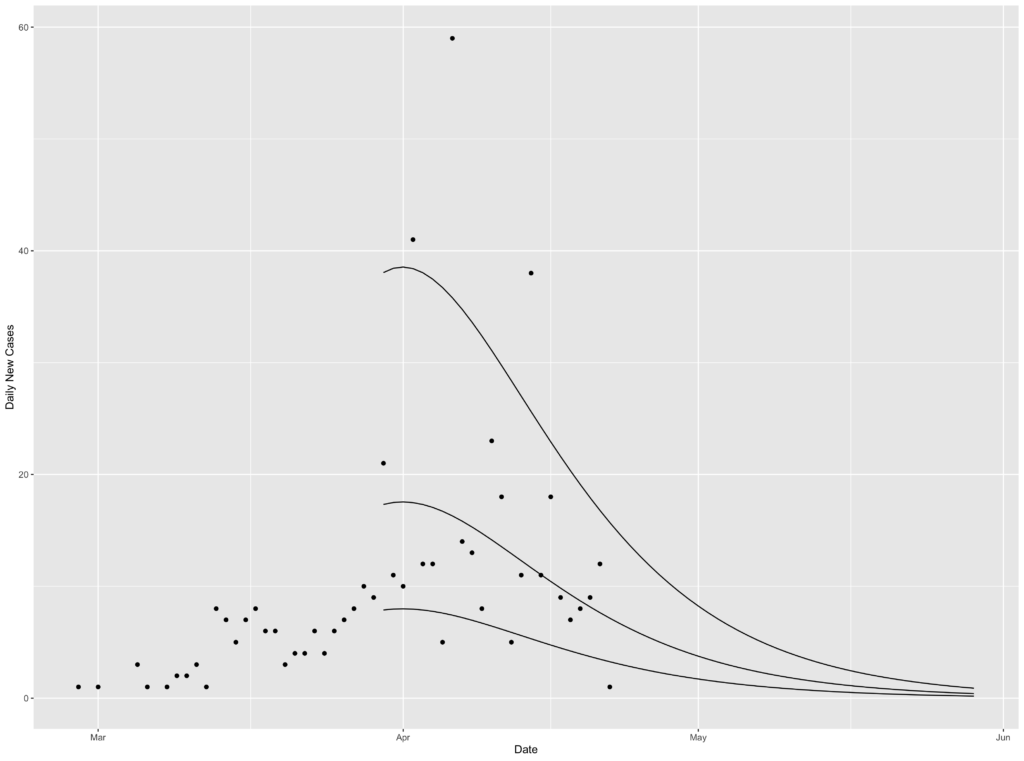
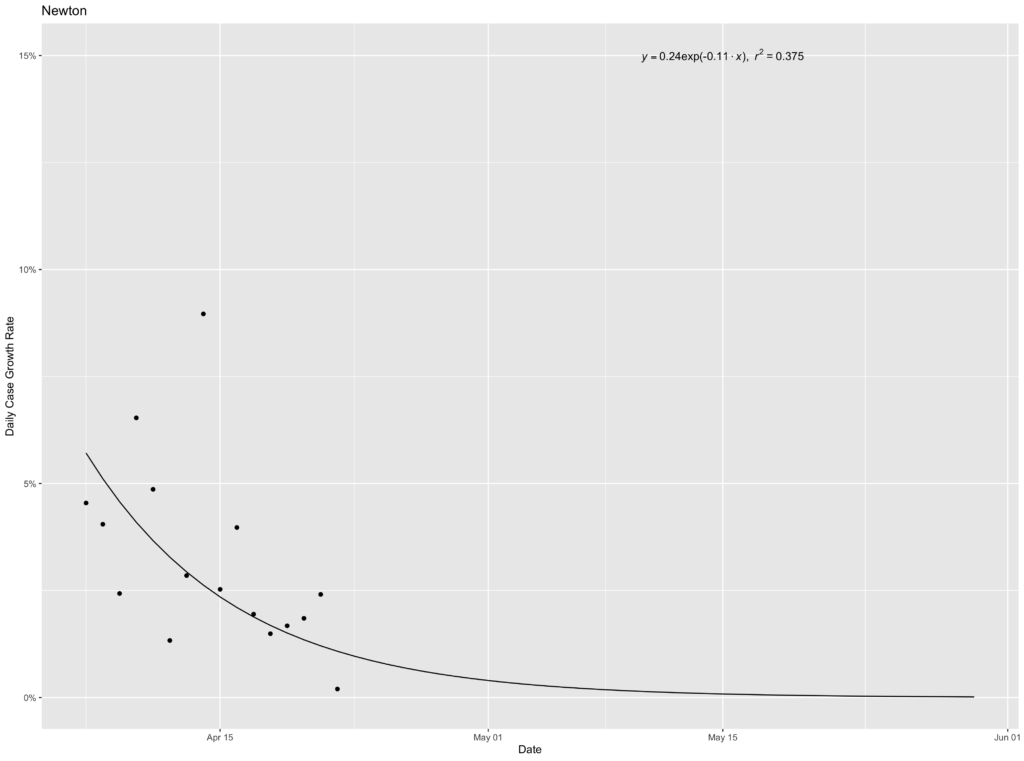
Below is a more detailed forecasting report using this data. It shows Newton is currently bending its curve at an average of -11% per day. This analysis forecasts ~100 more cases before the end of May, with daily cases starting to drop to 0 intermittently in early May, but ongoing spread persisting into late May.
Apologies for small text. Still learning R graphics…
Jack. Thanks for sharing your graphs and explanations. It makes it easier to understand this terrible epidemic and lessen the fear