Updated 4/5/20 8pm
My family had a cancellation decision to make for a Vietnam holiday at the end of February so I have been following the COVID-19 data closely, first in China, then beyond China, then in the US, and now in Newton. See the bottom of this post for more information on the broader trends.
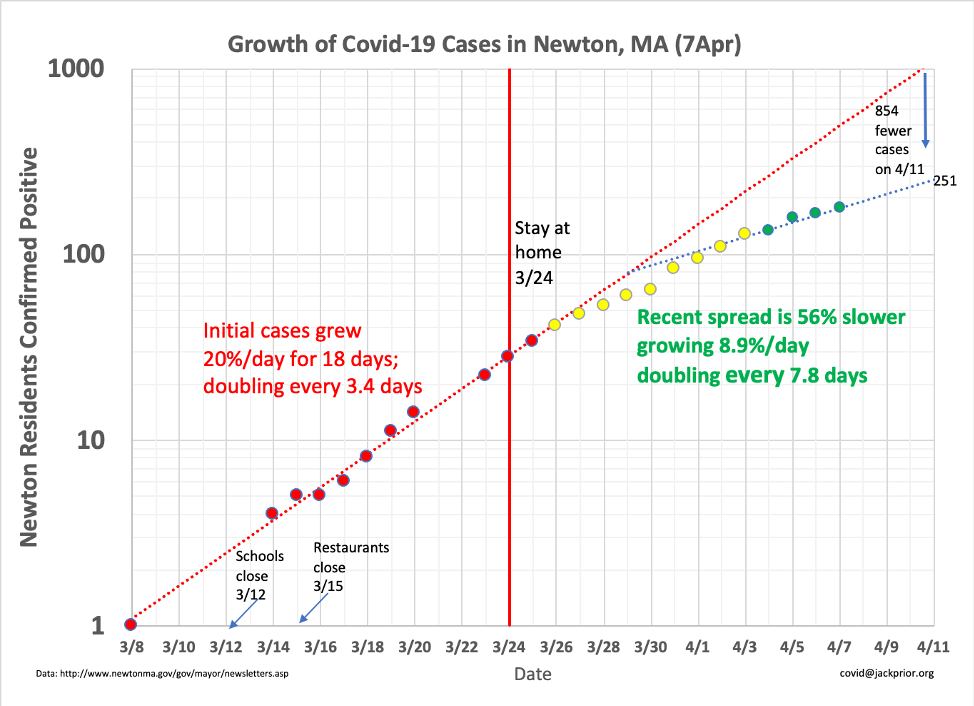
Mayor Fuller has been putting out information on the case count in Newton since March 8th. I have plotted the Newton data as I have been for other populations, simply using Excel to visualize it on a logarithmic scale with an exponential fit to project how it might progress.
In the initial phases of an epidemic, the disease spreads exponentially, with the day over day change increasing as a constant percentage of the previous day’s case or death count until it is slowed by social distancing, herd immunity, or less accessible populations. The doubling time is equal to ln(2) divided by the growth rate.
From the 1st reported case on March 8th to the 14th reported on March 20th, the case count has, on average, increased ~20% each day, doubling every 3.4 days.
After the #StayAtHome order was implemented, the growth in cases was cut to ~30% 72 hours later to 13.9% per day and doubling every 5 days.
[April 7th Update]
As has been seen in China and the EU as reflected in recent market optimism, the growth rate in Newton appears it may be slowing with social distancing more solidly in place. The 4 most recent points suggest a second reduction in growth rate to 8.9% and a doubling time of 7.2 days.
This is headed towards the improvements seen in the Seattle area.
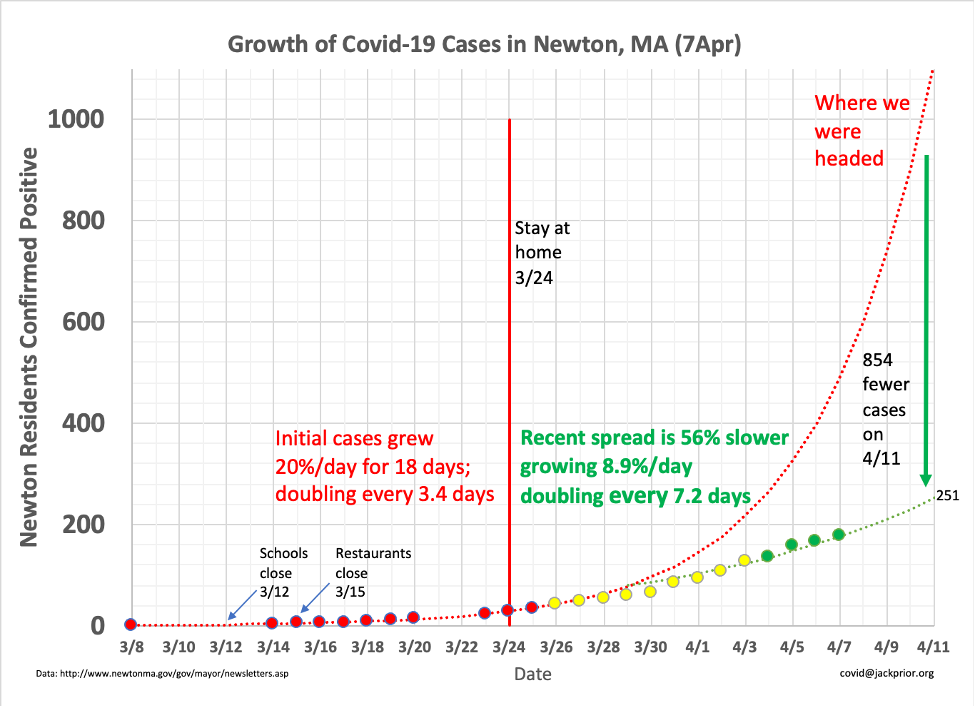
As the figure shows, that reduction in rate has a significant impact on the projected cases going forward into early April, reducing them from over 1000 to ~251. A big caveat on this is that testing has been limited, and actual cases are higher with an unknown trend. I’ll update this plot as the city provide more daily information.
Here is exactly the same graph, but on a linear rather than log scale. You can see the stark difference between where were head and our current trajectory:
Jack – I’ve been checking this daily and love the graphs and data. Thank you. Question for you: The graphs are labeled “COVID-19 cases”. Do these figures that you’re showing reflect positive tests for the novel coronavirus (which may or may not lead to any meaningful symptoms of the COVID-19 disease), or do your figures reflect symptomatic cases of COVID-19? If the latter, how severe must symptoms be to be included in your count? If the former, perhaps the graphs should be labeled as such. The novel coronavirus may lead to a respiratory disease known as COVID-19; people are using the terms loosely and interchangeably, but there are a material amount of people testing positive who develop no symptoms. Thanks
Hi Chris — The data comes directly from https://www.worldometers.info/coronavirus/, which reflects reporting practices from across the country. Given the limited testing available, generally speaking most identified cases are likely symptomatic cases. I tried to get some feel for how many unconfirmed cases might be out there in this post: https://covid19.jackprior.org/2020/04/04/what-is-the-covid-19-infection-fatality-rate/