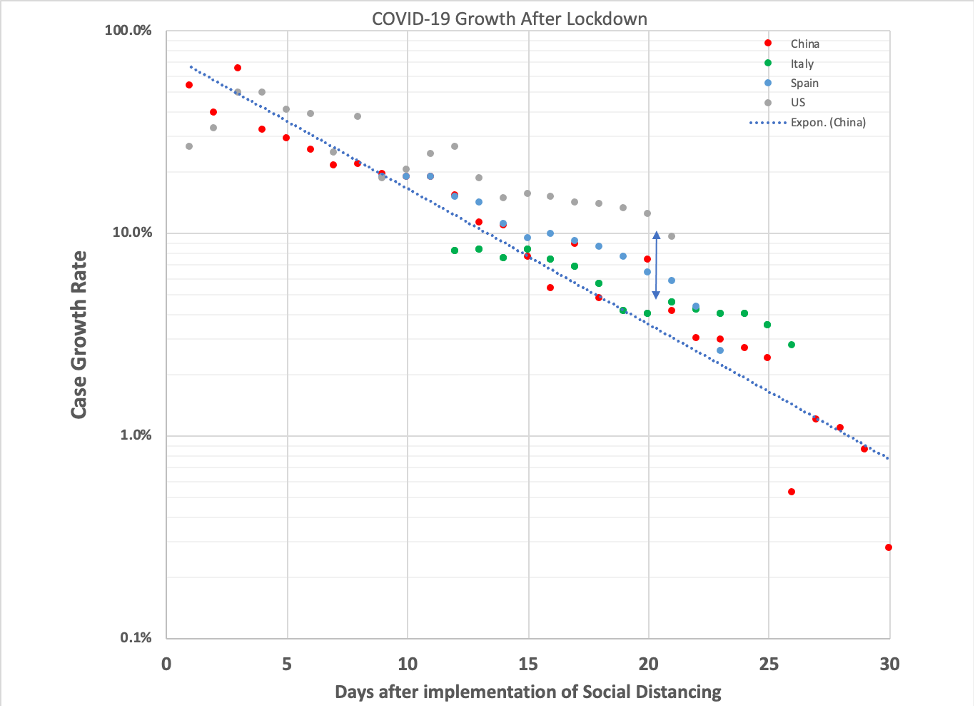
The key insight that enables the http://app.jackprior.org forecasting tool is the observation that each state or country has a characteristic rate at which it is flattening the curve.
Continue reading “What is the Social Distance Model Window?”Month: April 2020
Will MA Have More Covid-19 Deaths than Hospitalizations?

4/28 Update:
With a few more recent data points and corrections compensating for the data gap in the Covidtracking.com feed the forecasted death curve has flattened considerably and does not show the crossover forecasted a few days ago.
Read moREapp.jackprior.org
In order to make it easier for folks to explore data of interest up to the minute I set up a web page that allows you to interactively explore Covid-19 from various states in the US.

Newton 4/23 Update
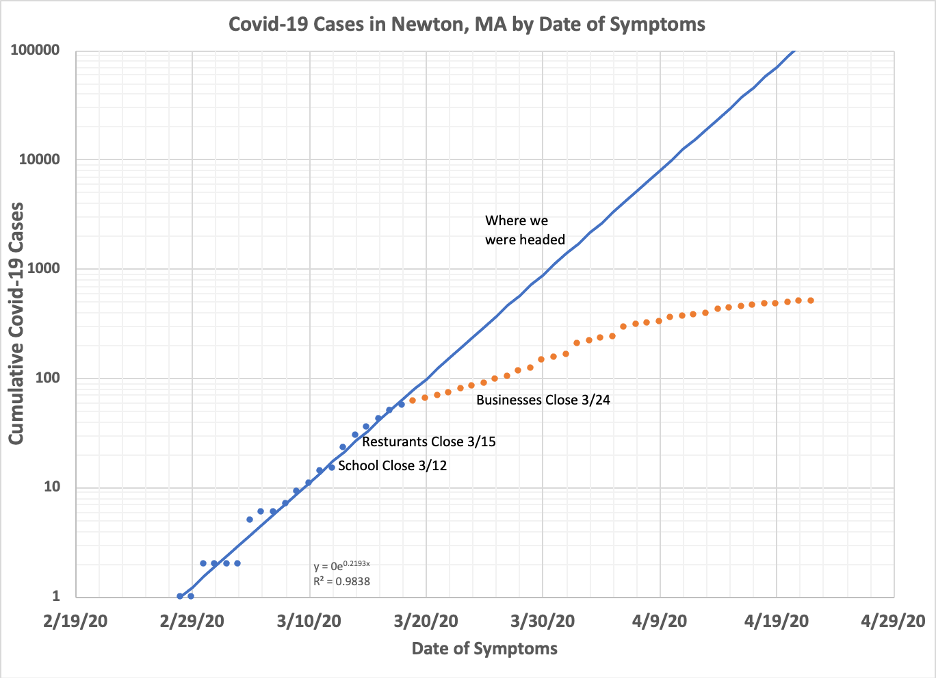
The Mayor’s office updated the way it reports data to track it back to the date of initial symptoms rather than when the case was confirmed. Previously case reports had gaps and jumped up intermittently. This data also gives detailed daily data going back to the 1st reported case on 2/28.
Continue reading “Newton 4/23 Update”Latest Projections (21Apr)
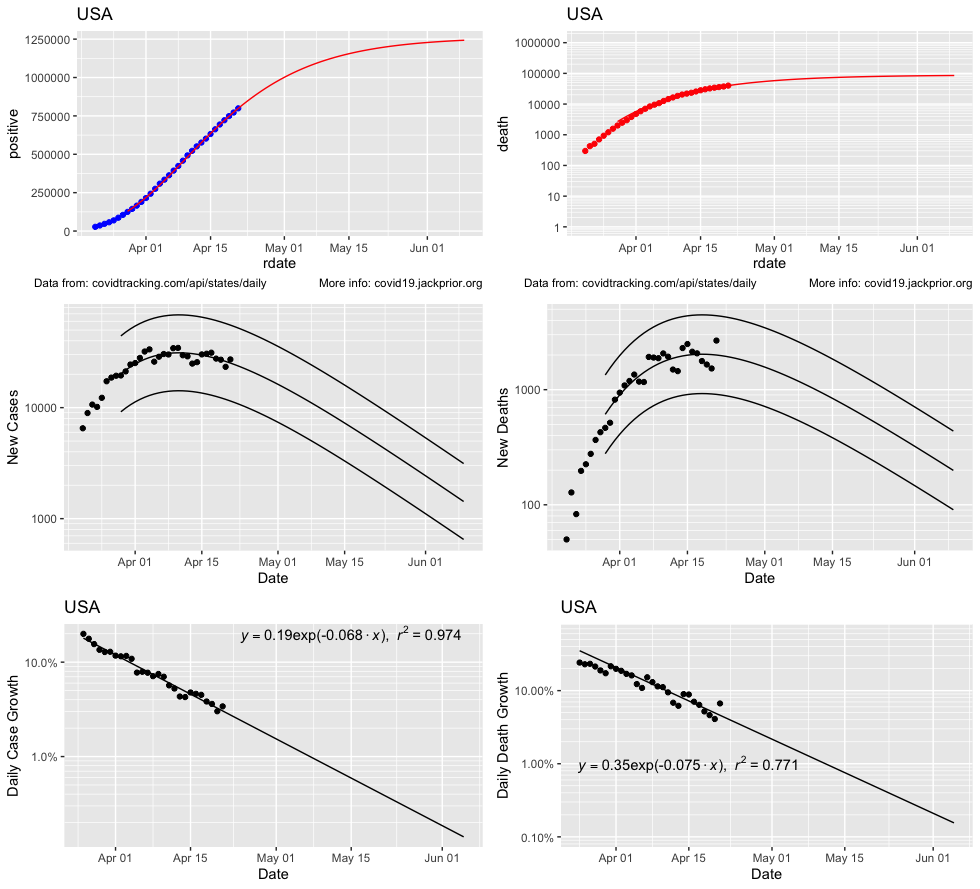
It is surprisingly hard to do things in R that are easy in Excel, but at least now it is automated using data from covidtracking.com. This is hot of the press and needs debugging and sensitivity analysis. I am not an epidemiologist and am just looking for simple patterns to extrapolate. Some of these projections seem unreasonable, or perhaps just depressing. In particular, the extrapolations for deaths seem too high for Massachusetts at the moment.
Continue reading “Latest Projections (21Apr)”Newton 4/14 Update
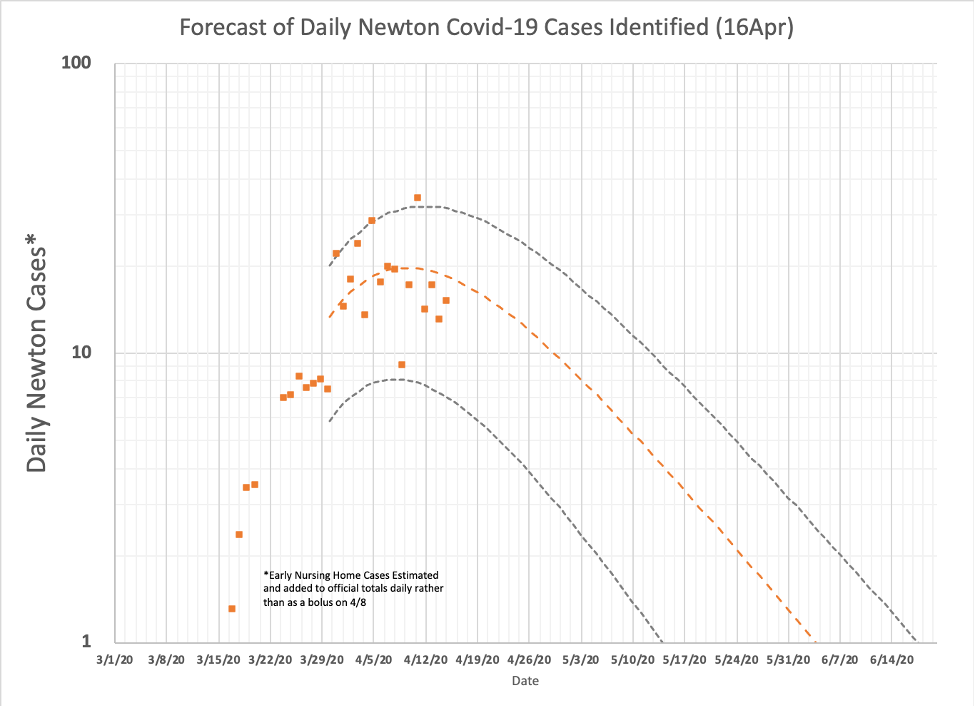
Until April 8th Newton had been following a relatively smooth trajectory of initial post-social-distancing slowing of Covid-19 cases similar to that see in the US. On that day the Mayor announced that ~68 Covid-19 cases had been detected in a local nursing home, adding 39% to Newton’s then total of 178 cases.
Continue reading “Newton 4/14 Update”Projecting Massachusetts COVID-19 Hospital Admissions
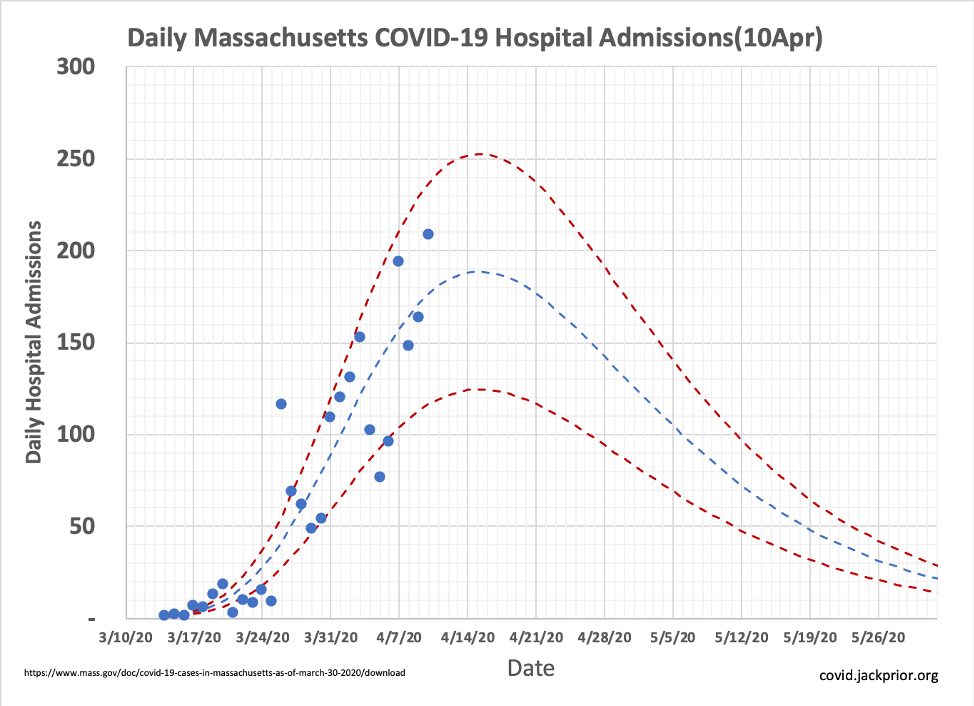
Information on Massachusetts Hospital Admissions is available on the Mass.Gov COVID-19 Cases, Quarantine and Monitoring website. The growth rate* in daily admissions has been declining exponentially over time since social distancing was implemented.
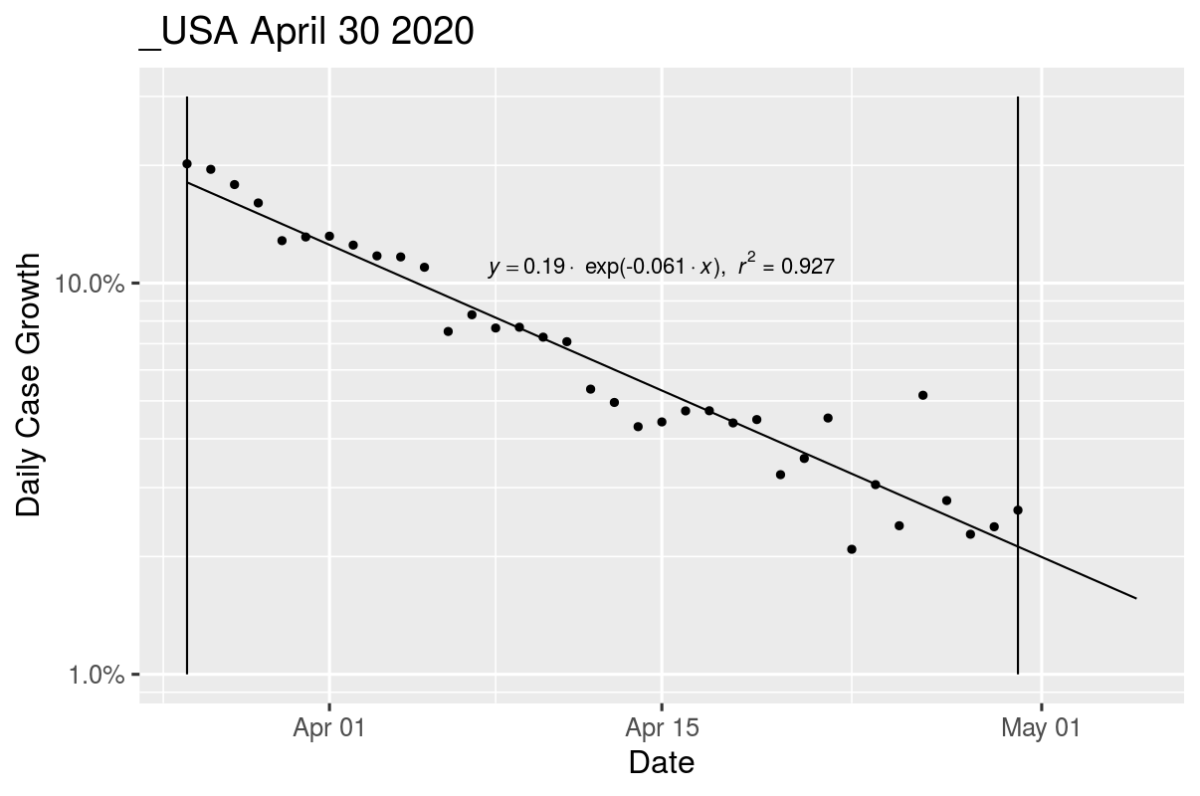
Continue reading “Projecting Massachusetts COVID-19 Hospital Admissions”Projecting the Flattening Curve In the United States
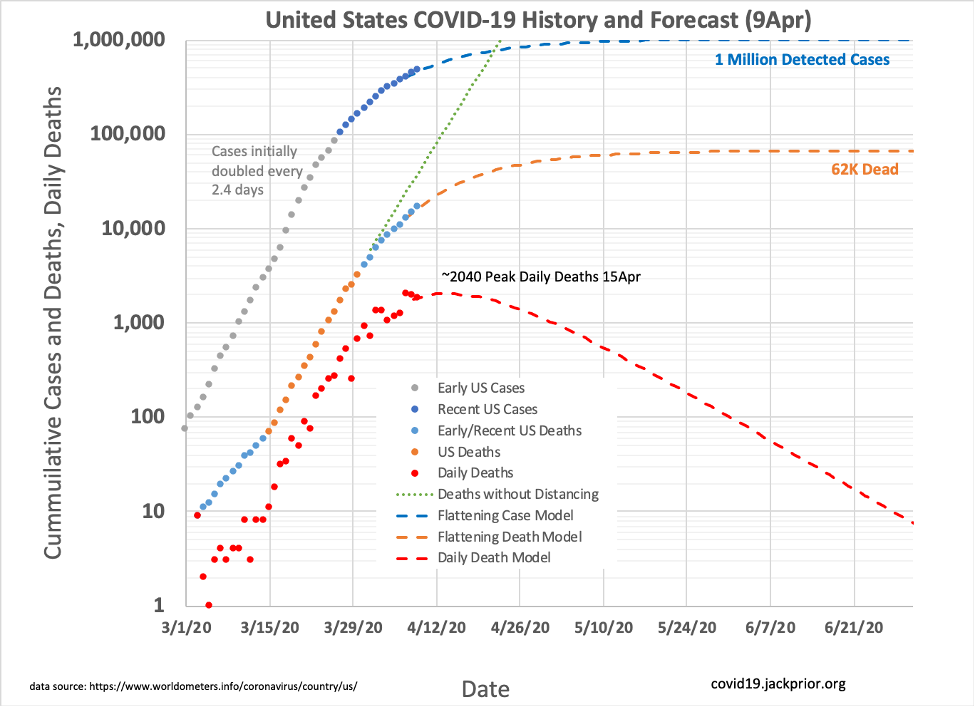
[Daily Plot at bottom added 4/17]
As countries around the world have implemented social distancing, they have seen an exponential decrease in their daily case growth rates, each likely reflecting their distancing practices. This pattern can be used to project estimates of how cases and deaths will progress in the US in the coming weeks and months.
Continue reading “Projecting the Flattening Curve In the United States”Today’s optimism
Financial markets rose today on signs that the virus is being slowed in the EU and providing hope that #SocialDistancing can achieve the near eradication of #COVID19 seen in China.
Continue reading “Today’s optimism”The Science of Social Distancing
Here are some computational fluid dynamics simulations done by CBBL@OSU of someone coughing at various distances from ANSYS using the Fluent software.
Click on this video to see how keeping social distance keeps you and others safer.

Note that a COVID-19 positive patient may be releasing viral particles of various sizes and smaller/lighter particles will linger in air longer than heavier respiratory droplets.