Metrics for Reopening Readiness

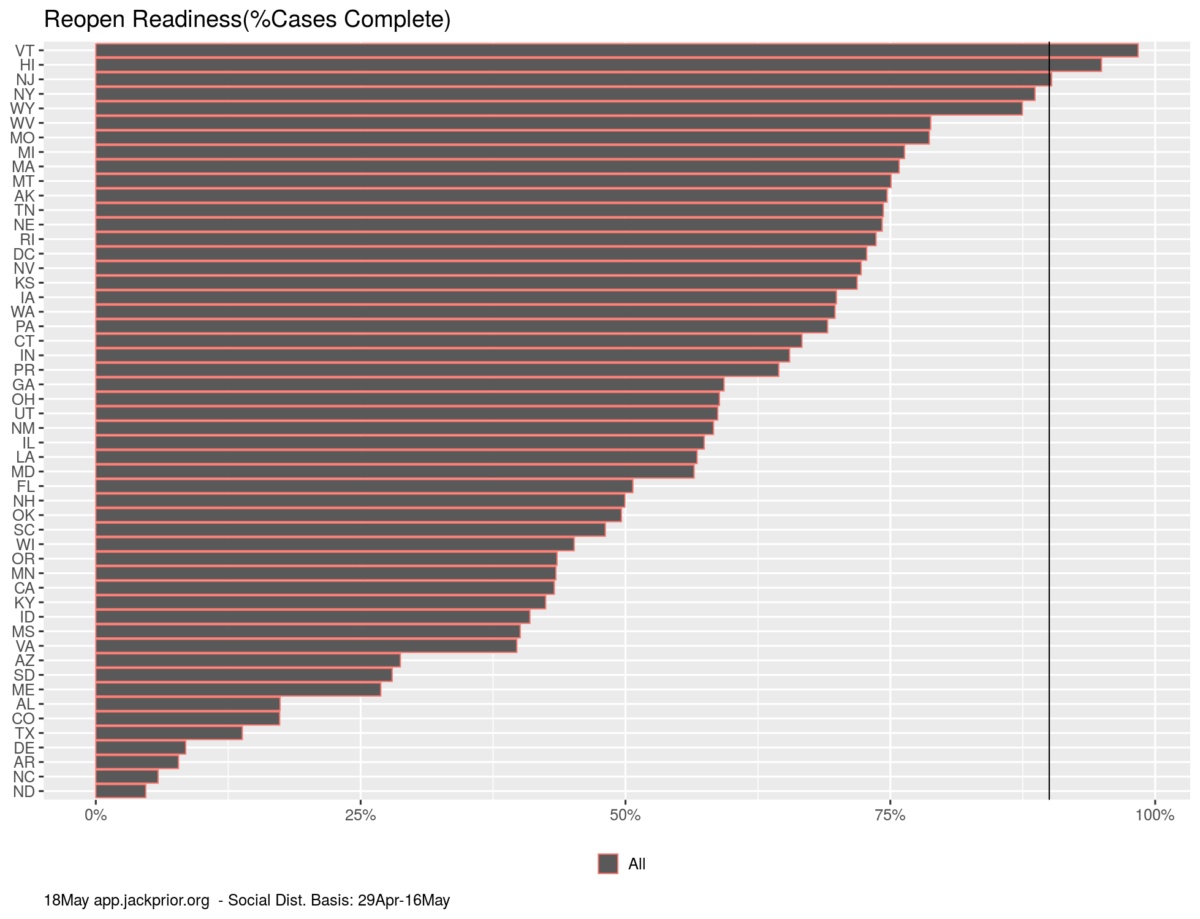
As the countries and states start to move to reopen, the metrics by which these decisions are being made are not clear and not consistent.

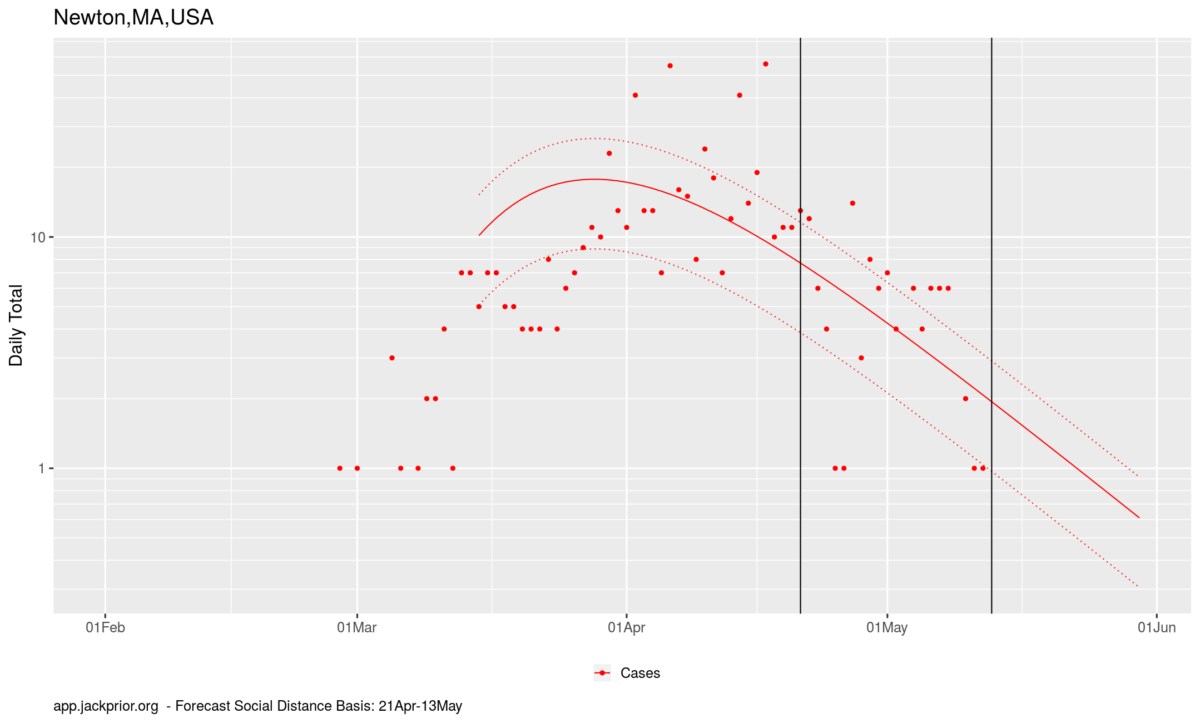
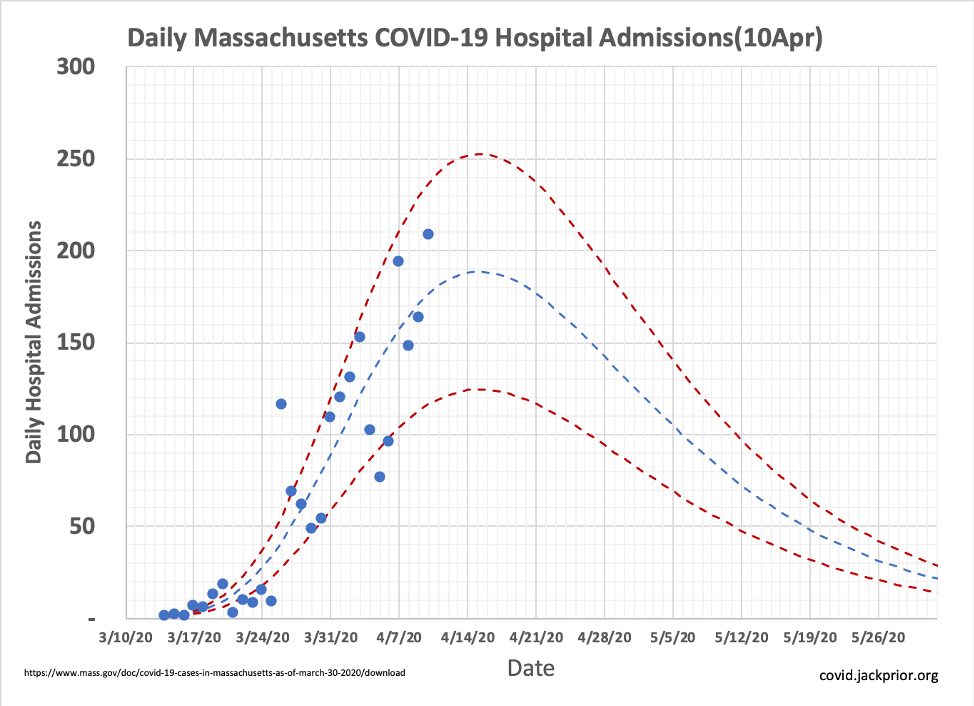
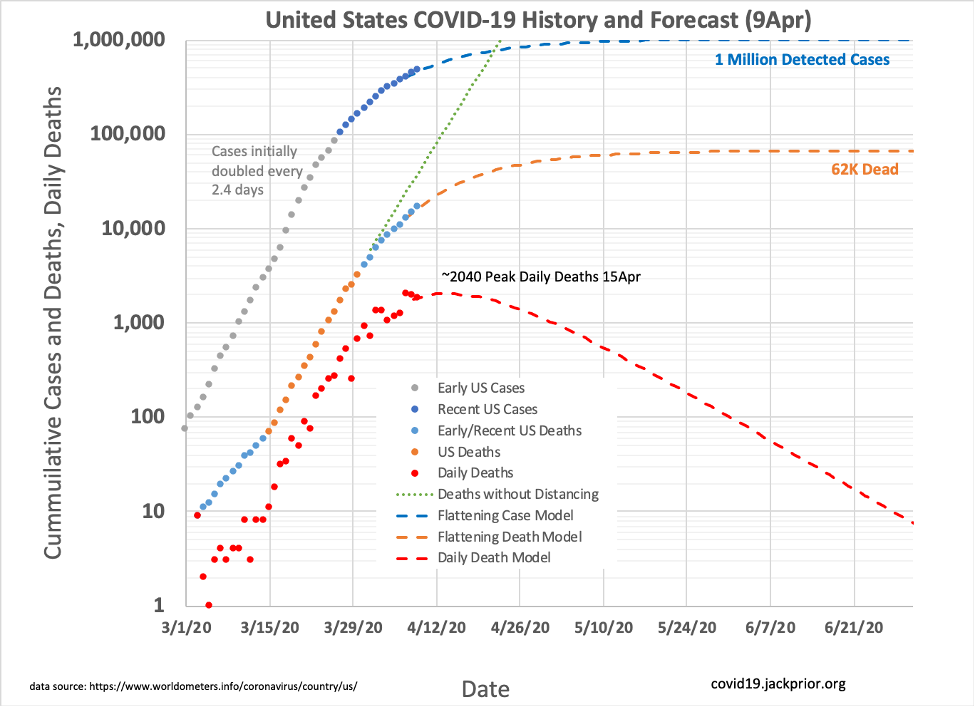
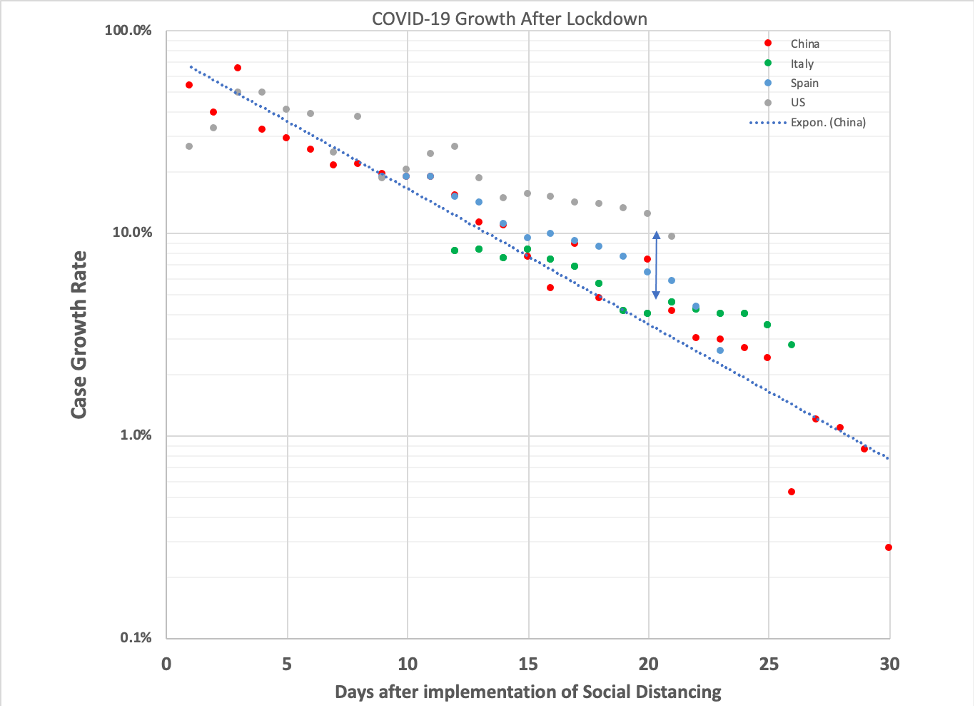
Each region is going through an “S-Curve” of initial exponential growth followed by a flattening brought on by social distancing. Although many regions are beyond their peak, the degree to which they have moved their daily counts downward, and how fast that is happening, varies greatly.

We don’t want to move back into a burning building.

Continue reading “Metrics for Reopening Readiness”

Newton May 13th Update

Newton Covid-19 data is now incorporated in app.jackprior.org. The forecast shows Newton largely through its infection period, with cases potentially starting to average under 1 new case per day 10 days from now. Newton has had 675 cases and is forecast to have another 25. Newton has been steadily slowing its case growth by 9%/day, which is quite fast compared with Massachusetts as a whole, which has been steadily dropping at -5.9%/day.

Continue reading “Newton May 13th Update”

Latest Projections (21Apr)

It is surprisingly hard to do things in R that are easy in Excel, but at least now it is automated using data from covidtracking.com. This is hot of the press and needs debugging and sensitivity analysis. I am not an epidemiologist and am just looking for simple patterns to extrapolate. Some of these projections seem unreasonable, or perhaps just depressing. In particular, the extrapolations for deaths seem too high for Massachusetts at the moment.

Continue reading “Latest Projections (21Apr)”

Projecting Massachusetts COVID-19 Hospital Admissions

Information on Massachusetts Hospital Admissions is available on the Mass.Gov COVID-19 Cases, Quarantine and Monitoring website. The growth rate* in daily admissions has been declining exponentially over time since social distancing was implemented.

Continue reading “Projecting Massachusetts COVID-19 Hospital Admissions”

Projecting the Flattening Curve In the United States

[Daily Plot at bottom added 4/17]

As countries around the world have implemented social distancing, they have seen an exponential decrease in their daily case growth rates, each likely reflecting their distancing practices. This pattern can be used to project estimates of how cases and deaths will progress in the US in the coming weeks and months.

Continue reading “Projecting the Flattening Curve In the United States”

The Science of Social Distancing

Here are some computational fluid dynamics simulations done by CBBL@OSU of someone coughing at various distances from ANSYS using the Fluent software.

Click on this video to see how keeping social distance keeps you and others safer.

Note that a COVID-19 positive patient may be releasing viral particles of various sizes and smaller/lighter particles will linger in air longer than heavier respiratory droplets.