Metrics for Reopening Readiness

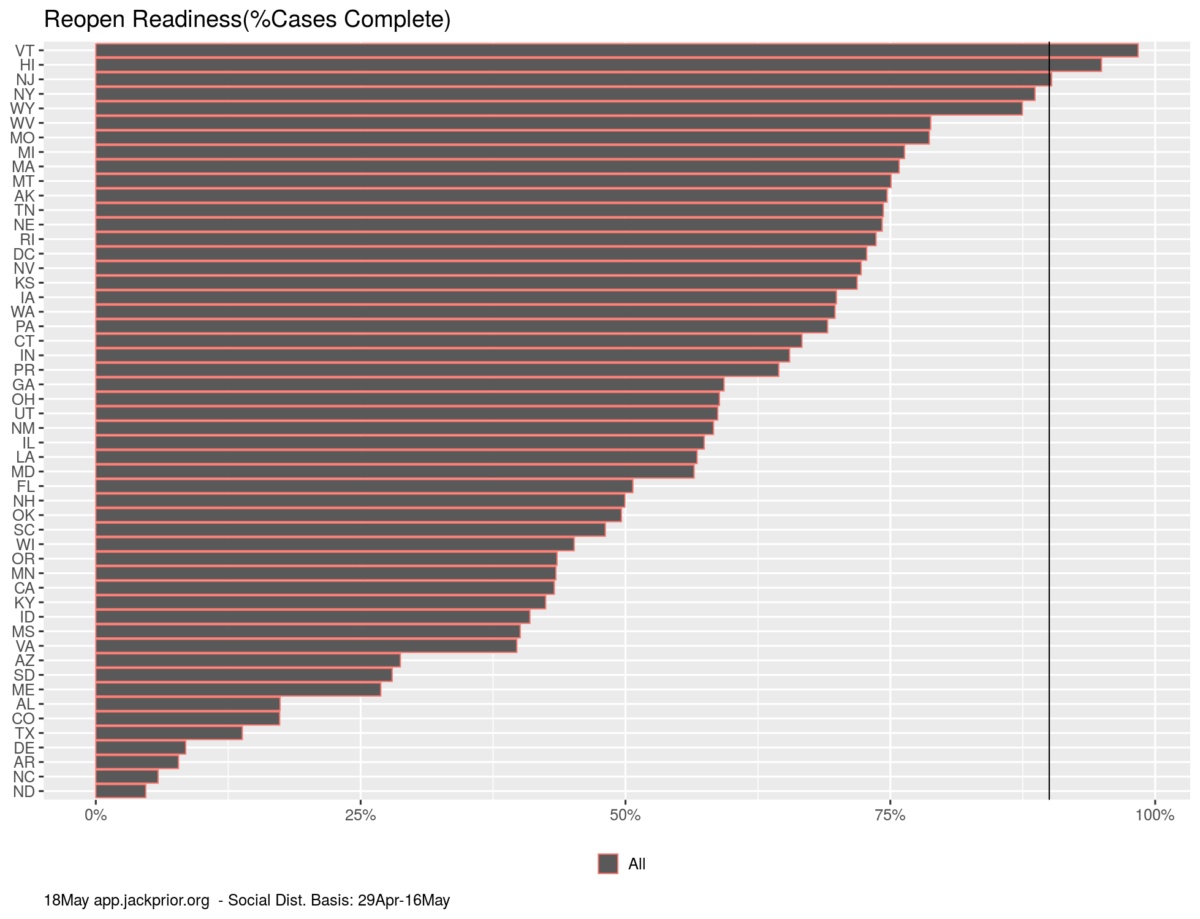
As the countries and states start to move to reopen, the metrics by which these decisions are being made are not clear and not consistent.

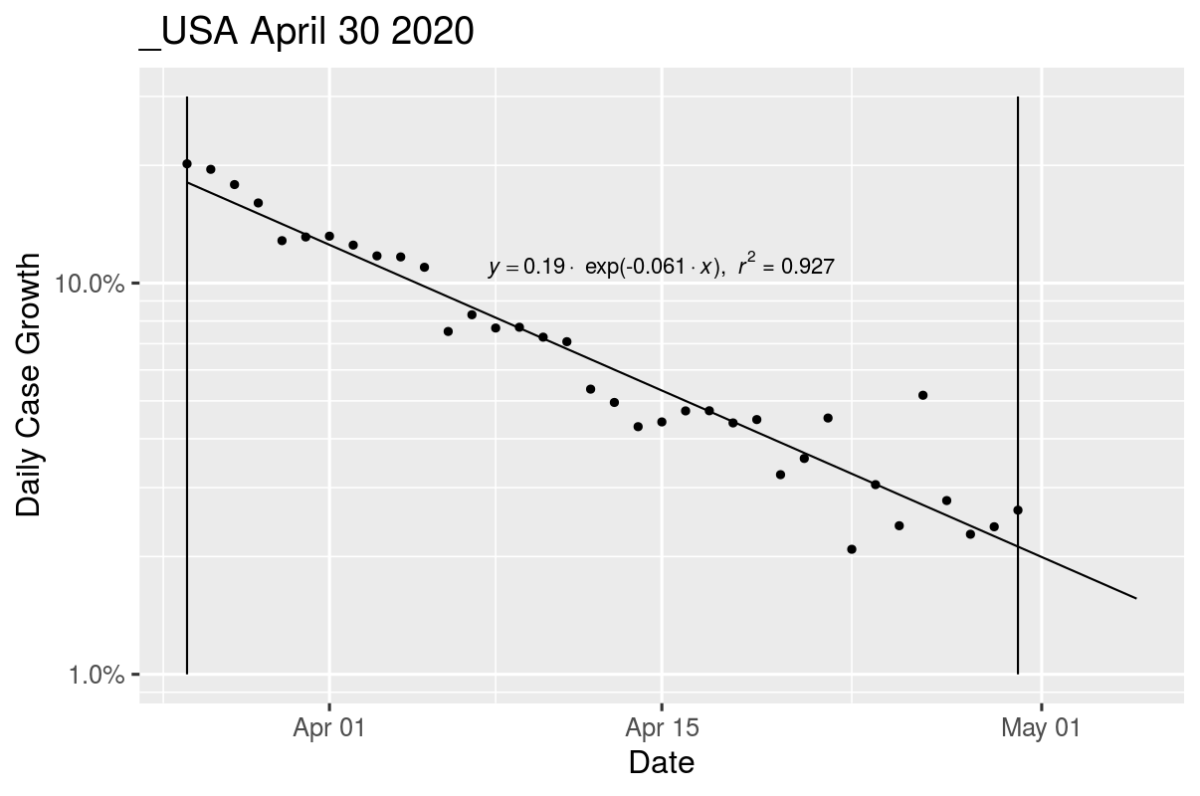
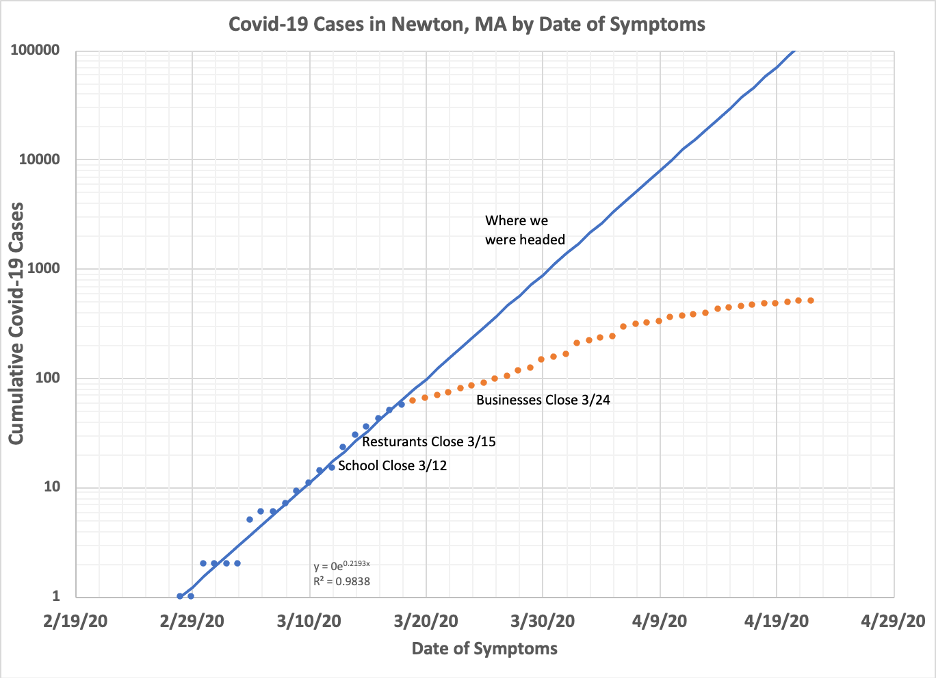
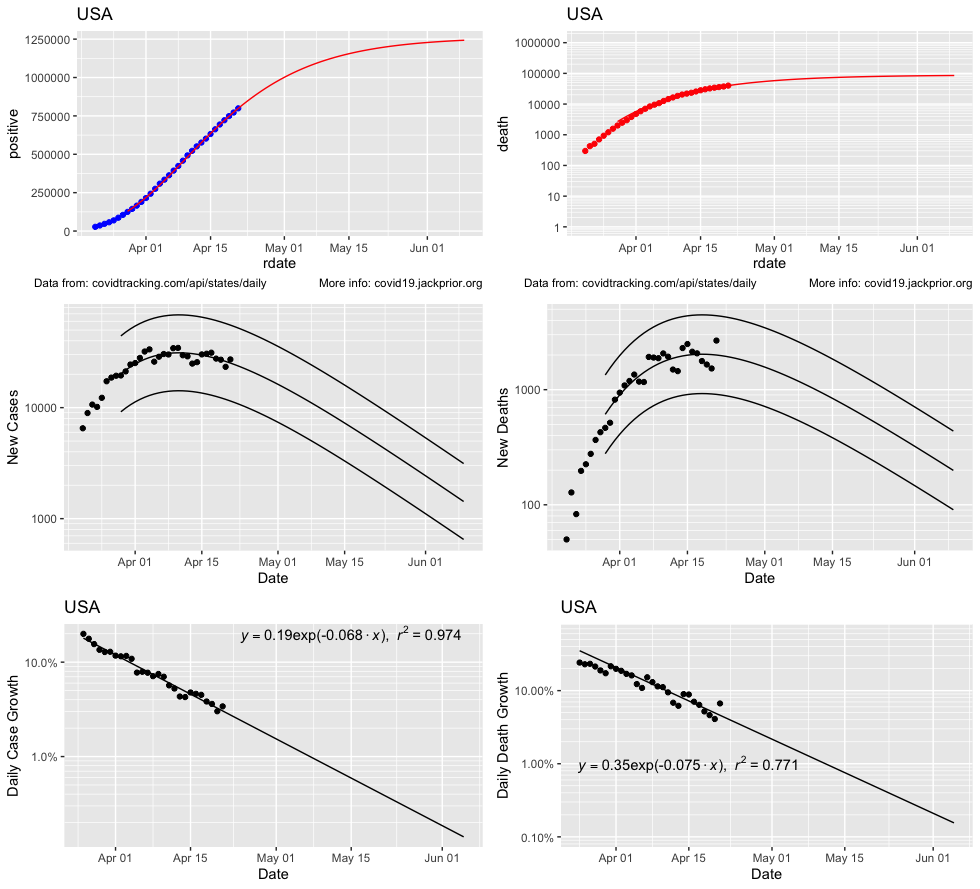
Each region is going through an “S-Curve” of initial exponential growth followed by a flattening brought on by social distancing. Although many regions are beyond their peak, the degree to which they have moved their daily counts downward, and how fast that is happening, varies greatly.

We don’t want to move back into a burning building.

Continue reading “Metrics for Reopening Readiness”
Newton May 13th Update

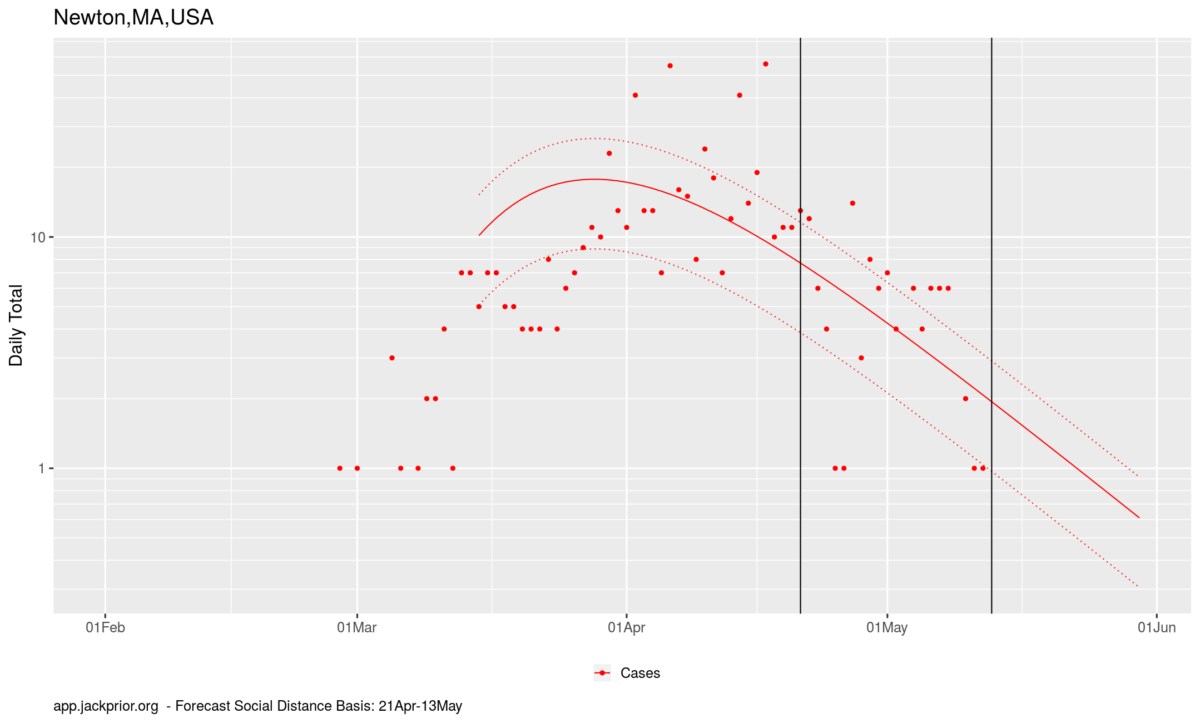
Newton Covid-19 data is now incorporated in app.jackprior.org. The forecast shows Newton largely through its infection period, with cases potentially starting to average under 1 new case per day 10 days from now. Newton has had 675 cases and is forecast to have another 25. Newton has been steadily slowing its case growth by 9%/day, which is quite fast compared with Massachusetts as a whole, which has been steadily dropping at -5.9%/day.

Continue reading “Newton May 13th Update”

Updated MA Hospital Admission Forecast

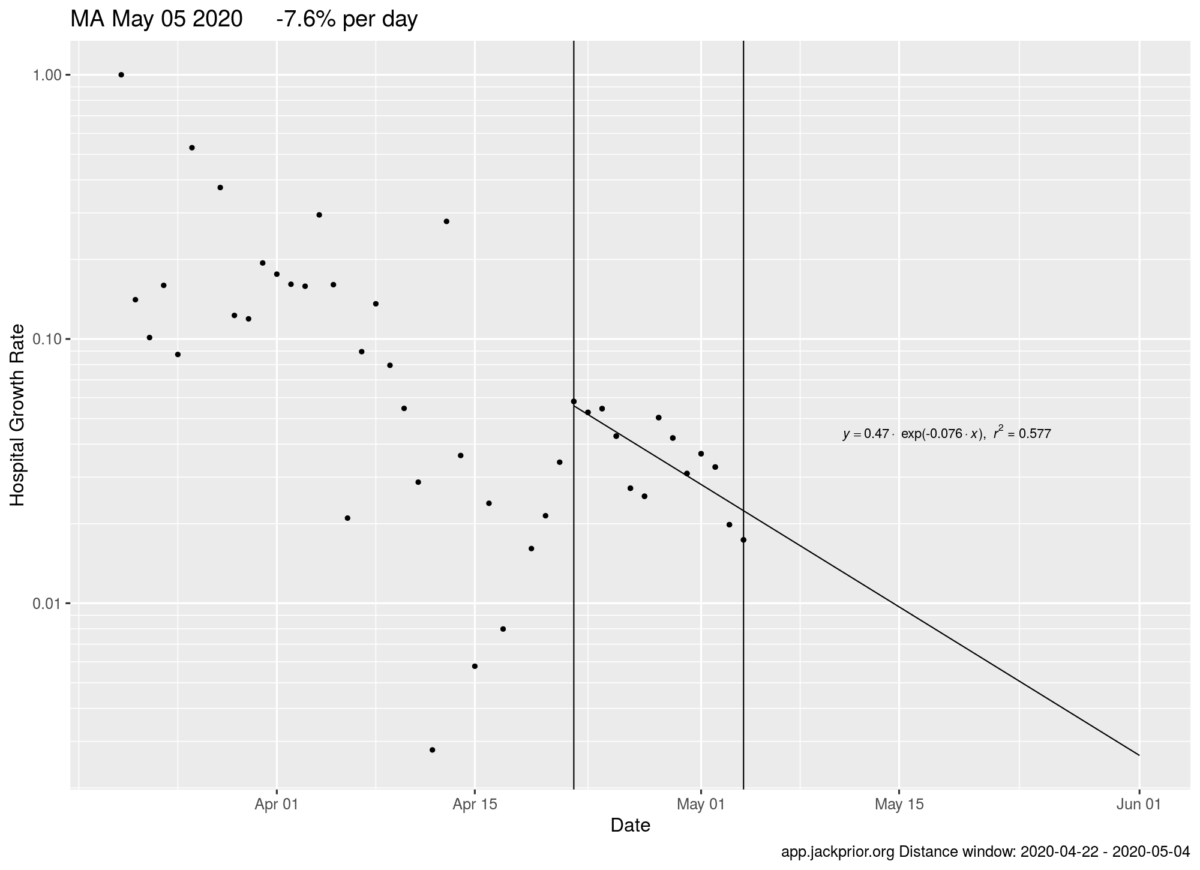
Back on April 11th, when the reported hospital admission total was ~2000, the forecast for May 4th was a total of 5800 admissions by May 4th with a peak on April 15th. On April 11th there was a 1-time ~1000 admission increase in reported cases are more hospital data was incorporated into the total. The reported total on May 4th was 6622, so within 200 admissions of the forecasts adjusting for the step change in reporting.

Using a forecasting data window of April 22th to May 4th , the forecast currently points to a June 1st total of ~8600 cummulative admissions by June 1st.

Continue reading “Updated MA Hospital Admission Forecast”

Contrasting China and US Social Distancing Impact on Flattening the Curve

App.JackPrior.Org now has the ability to adjust the time window of social distancing used in forecasting.

For any particular country you want to use the “Growth Rate” button to view the rate at which the daily growth rate is dropping and choose the window that best represents the country’s current social distancing practices for use in forecasting future behavior.

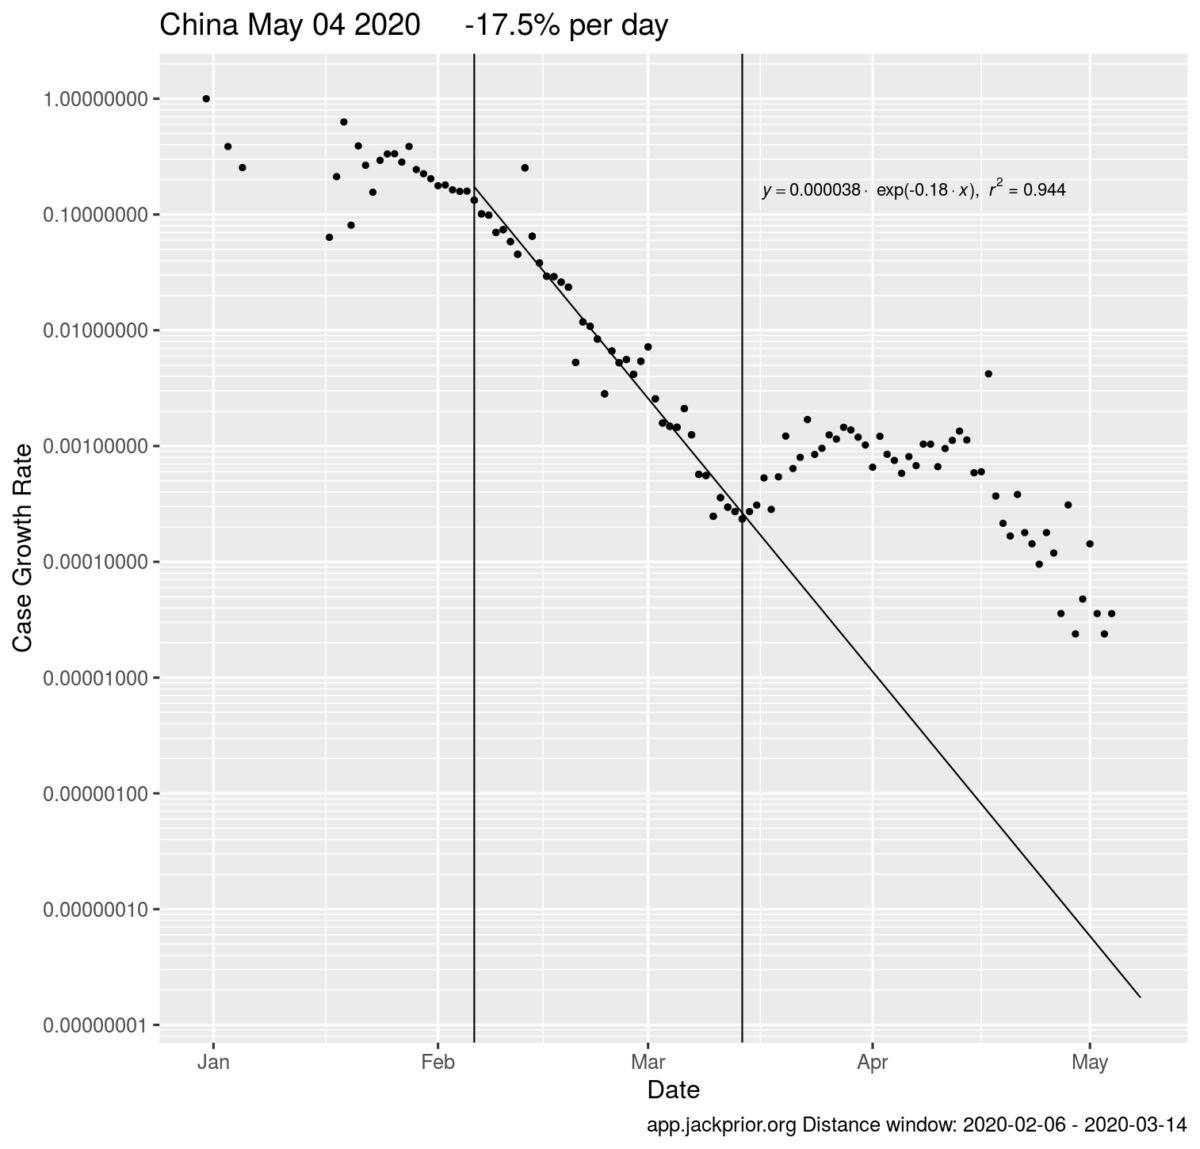
Looking at China’s case growth rate, their steep decline occurred between February 6th and March 14th and where their case growth rate dropped at a rate of 17.5% / day from 20% to 0. 003% in ~37 days.

Continue reading “Contrasting China and US Social Distancing Impact on Flattening the Curve”

Covid-19 Hospitalization Patterns By State

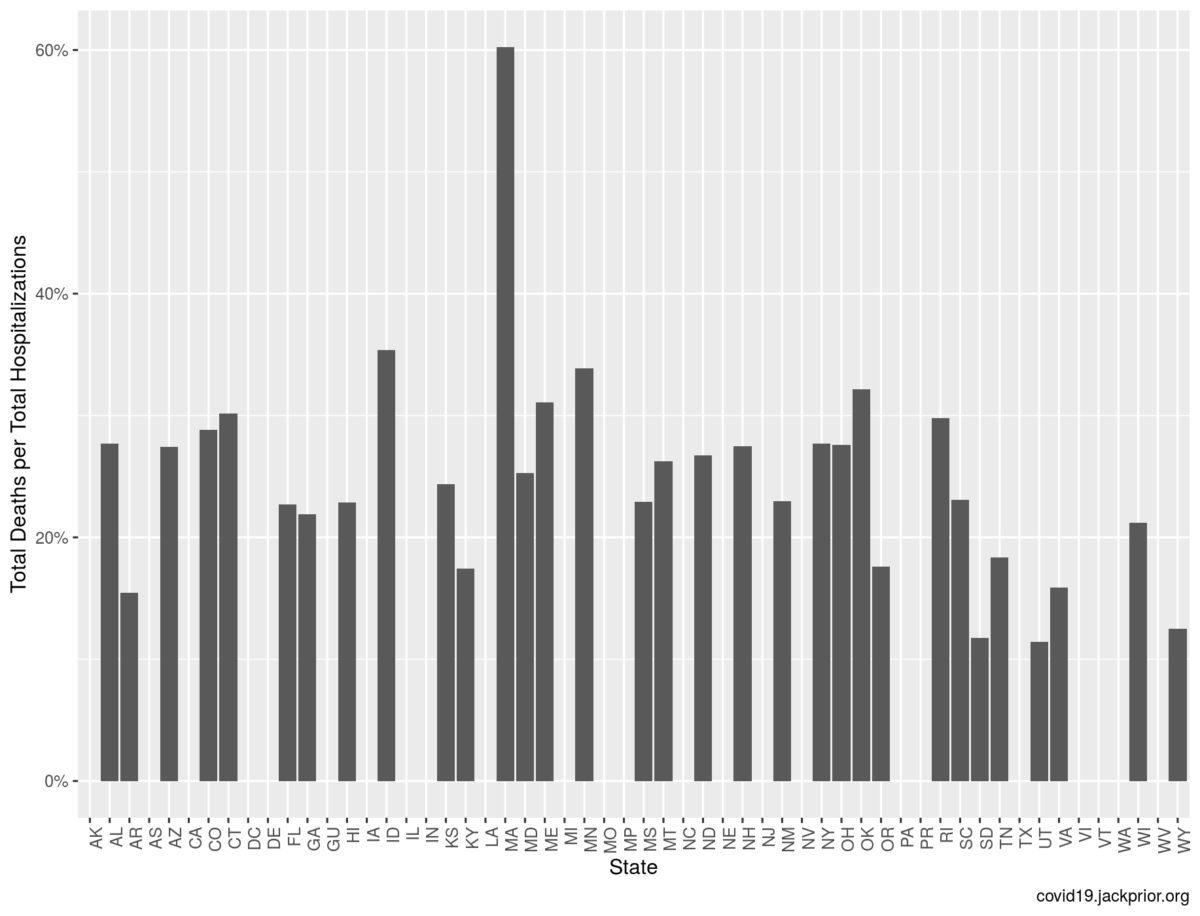
Massachusetts has nearly twice the number of total deaths per total hospitalizations than the next closest states on this metric. Daily Deaths and Hospitalizations are nearly equal in MA while in the remainder of the country hospitalizations tend to fall clearly above the rate of new deaths. Some hypotheses as to why this could be the case include treatment of nursing home patients outside of hospital settings or more deaths at home than in other states. See article from the globe on the slow drop in hospitalizations for MA.

Continue reading “Covid-19 Hospitalization Patterns By State”

Latest Projections (21Apr)

It is surprisingly hard to do things in R that are easy in Excel, but at least now it is automated using data from covidtracking.com. This is hot of the press and needs debugging and sensitivity analysis. I am not an epidemiologist and am just looking for simple patterns to extrapolate. Some of these projections seem unreasonable, or perhaps just depressing. In particular, the extrapolations for deaths seem too high for Massachusetts at the moment.

Continue reading “Latest Projections (21Apr)”