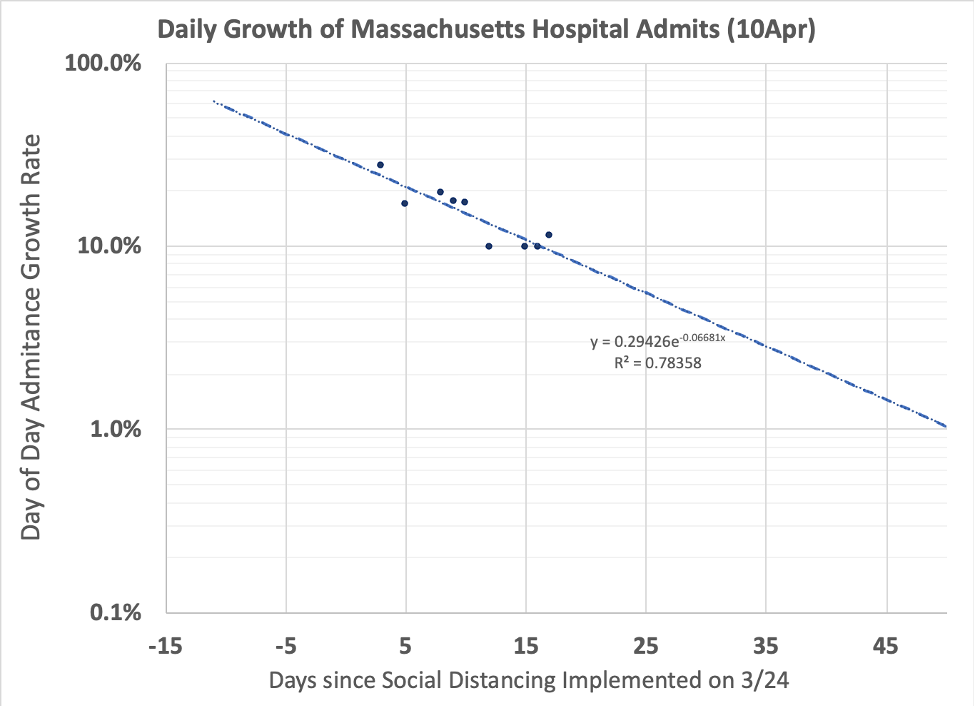
Information on Massachusetts Hospital Admissions is available on the Mass.Gov COVID-19 Cases, Quarantine and Monitoring website. The growth rate* in daily admissions has been declining exponentially over time since social distancing was implemented.

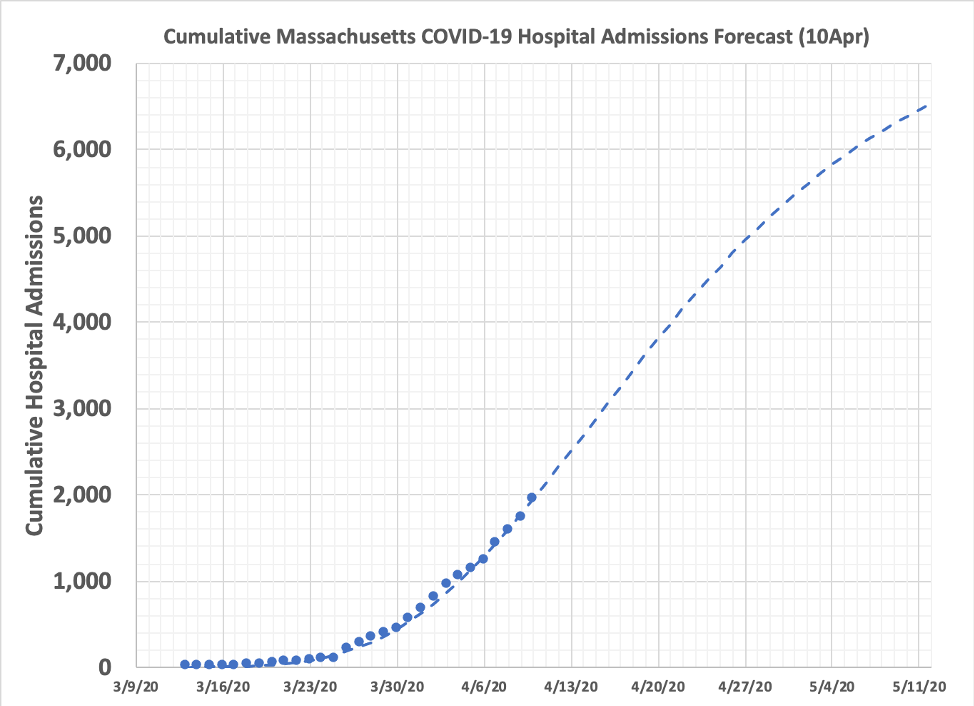
This pattern can be used to forecast the growth in cases in the coming weeks:

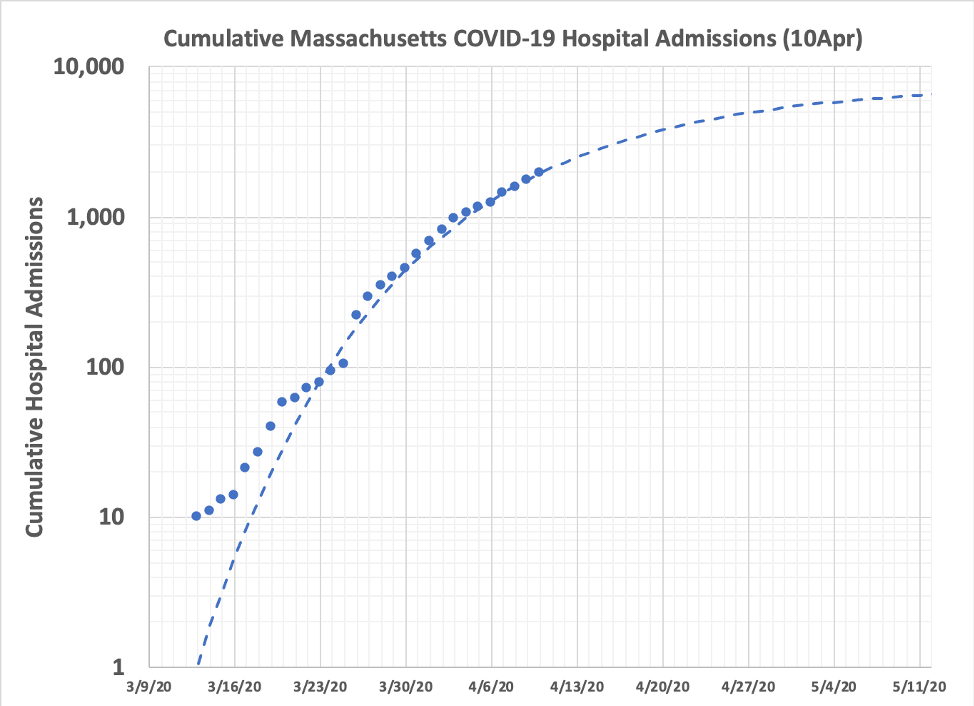
Here is the same data with a logarithmic Y axis so you can see the pattern in the data:

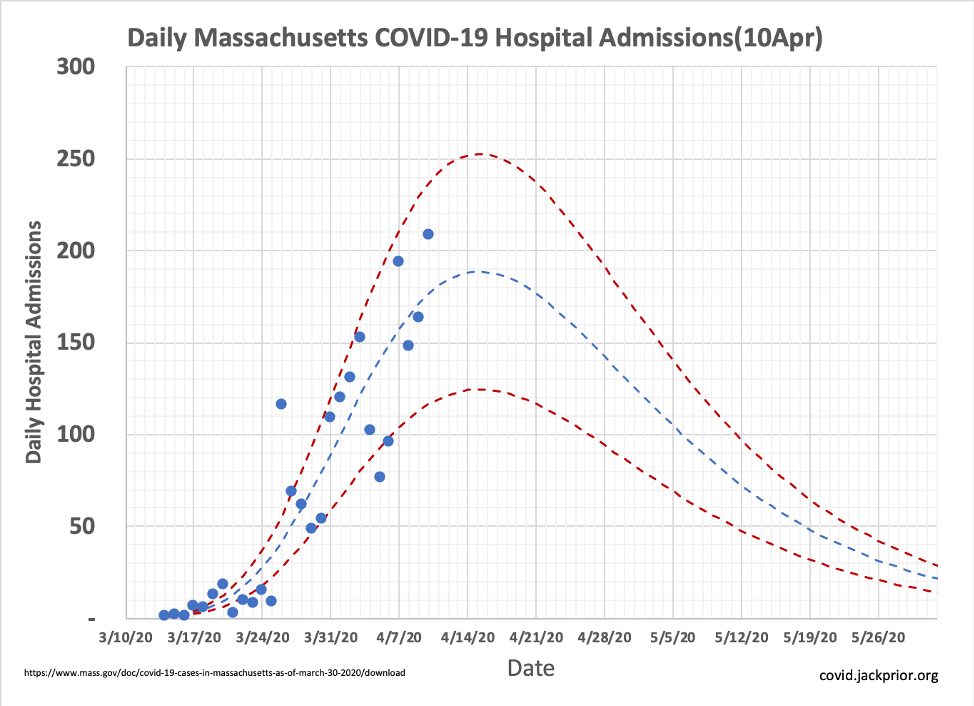
The model increase per day can be used to forecast the daily admissions over time. The declining increase in growth rate multiplied by the increasing cumulative admission leads to a curve that will peak in the coming days around April 15th. Note that the stress on the hospital comes not only with the admissions but by the duration of time and intensity the patients need to be treated for.

The future decline profile depends on sustained social distancing in MA and in the regions that travel to it. This site forecasts demands on the healthcare system in more detail.
* Note: The growth rate is calculated as u=ln(N1/N0)/(d1-d0). Data reported for Saturday through Monday is offset so the calculation is done on Sunday for the change between Friday and Tuesday. The spreadsheet used to generate the forecasts can be downloaded from this link. This work was done in collaboration with Joshua T. Cohen at the Tufts Medical Center.
One thought on “Projecting Massachusetts COVID-19 Hospital Admissions”