App.JackPrior.Org now has the ability to adjust the time window of social distancing used in forecasting.
For any particular country you want to use the “Growth Rate” button to view the rate at which the daily growth rate is dropping and choose the window that best represents the country’s current social distancing practices for use in forecasting future behavior.
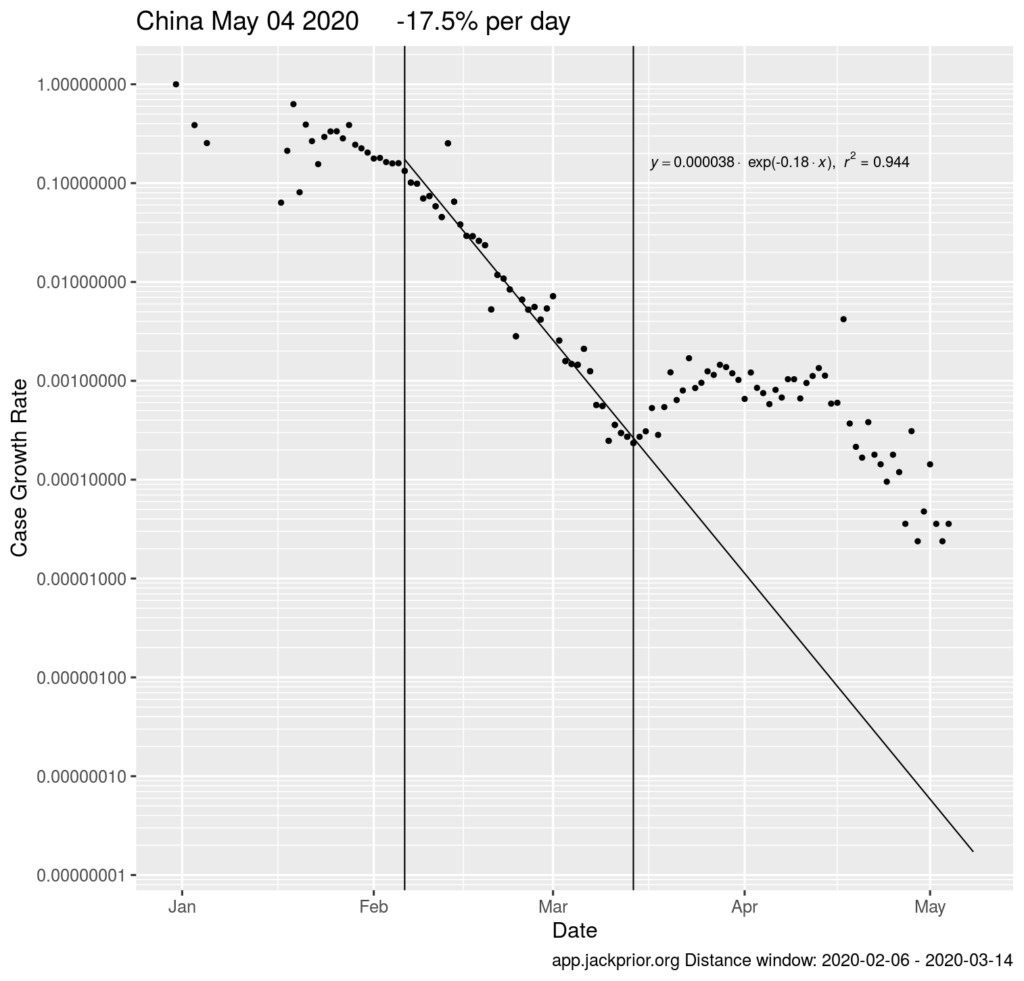
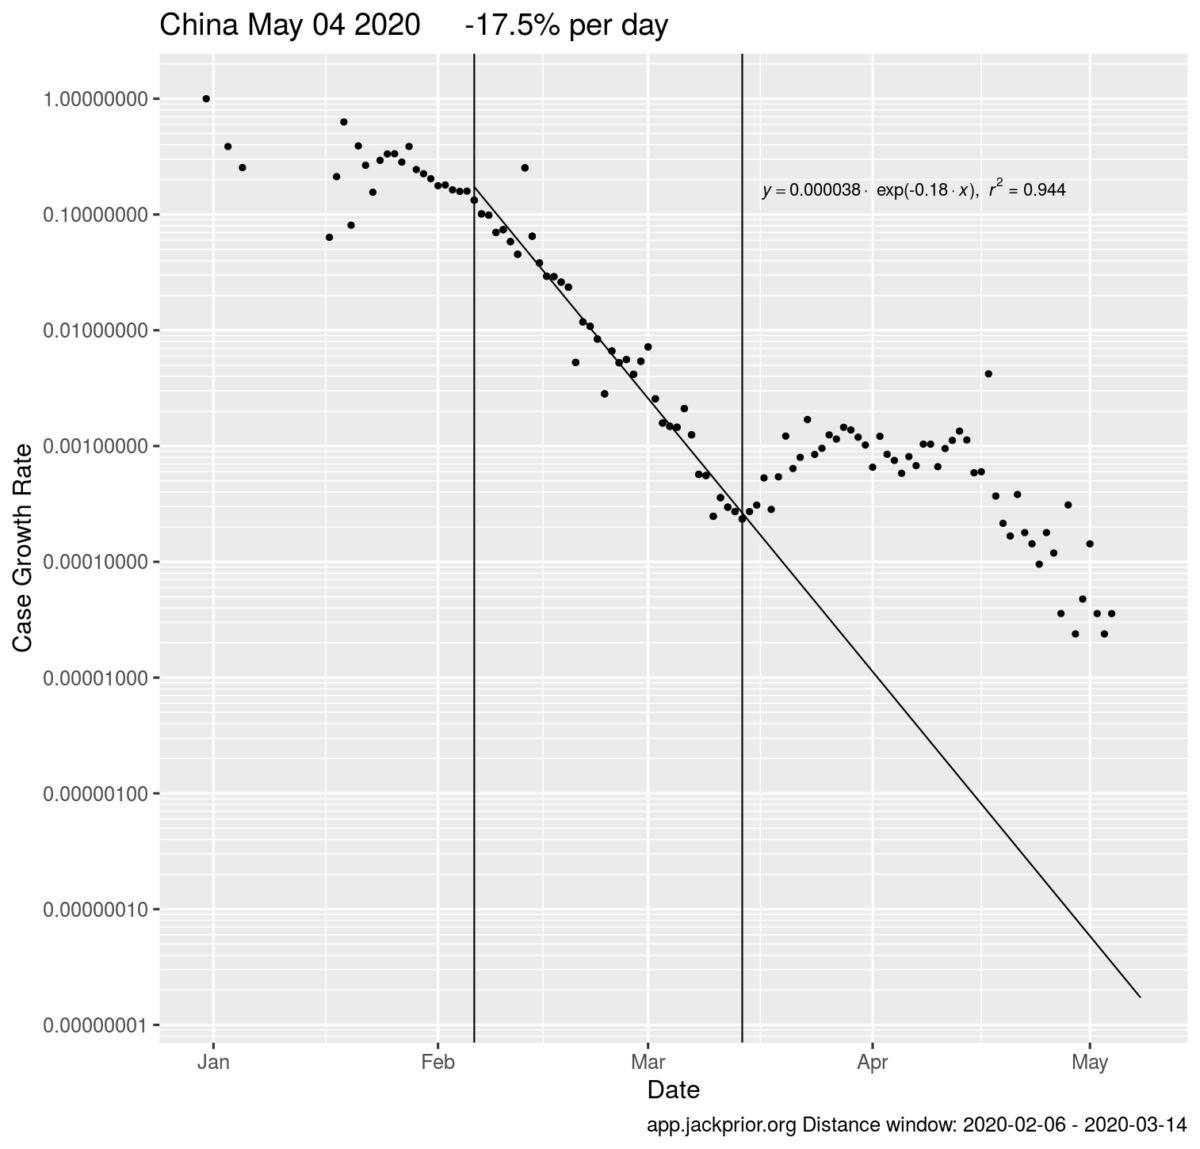
Looking at China’s case growth rate, their steep decline occurred between February 6th and March 14th and where their case growth rate dropped at a rate of 17.5% / day from 20% to 0. 003% in ~37 days.

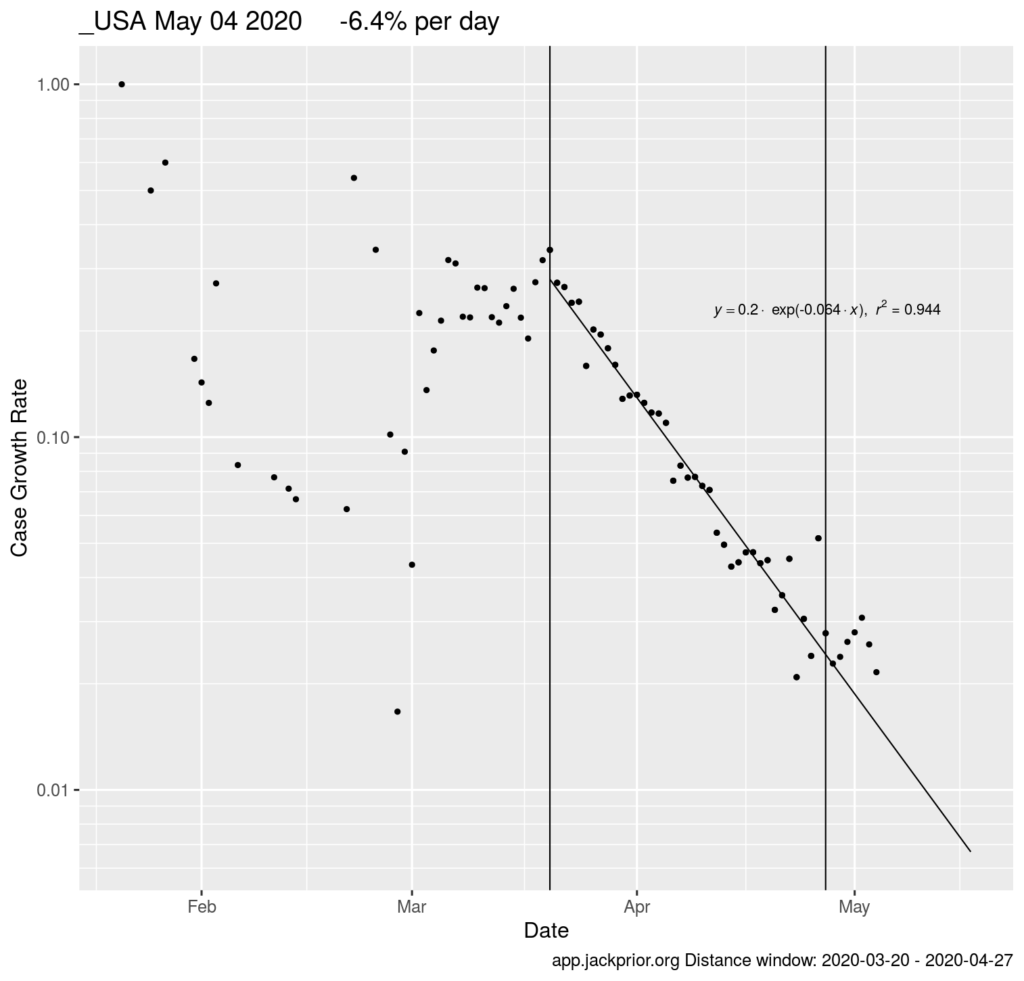
In contrast the US dropped from 28% to 2.5% at about one third that pace, at a rate of 6.4% per day, from March 20th to April 27th. Since April 27th the US may have started going a bit sideways in the last 5 days.

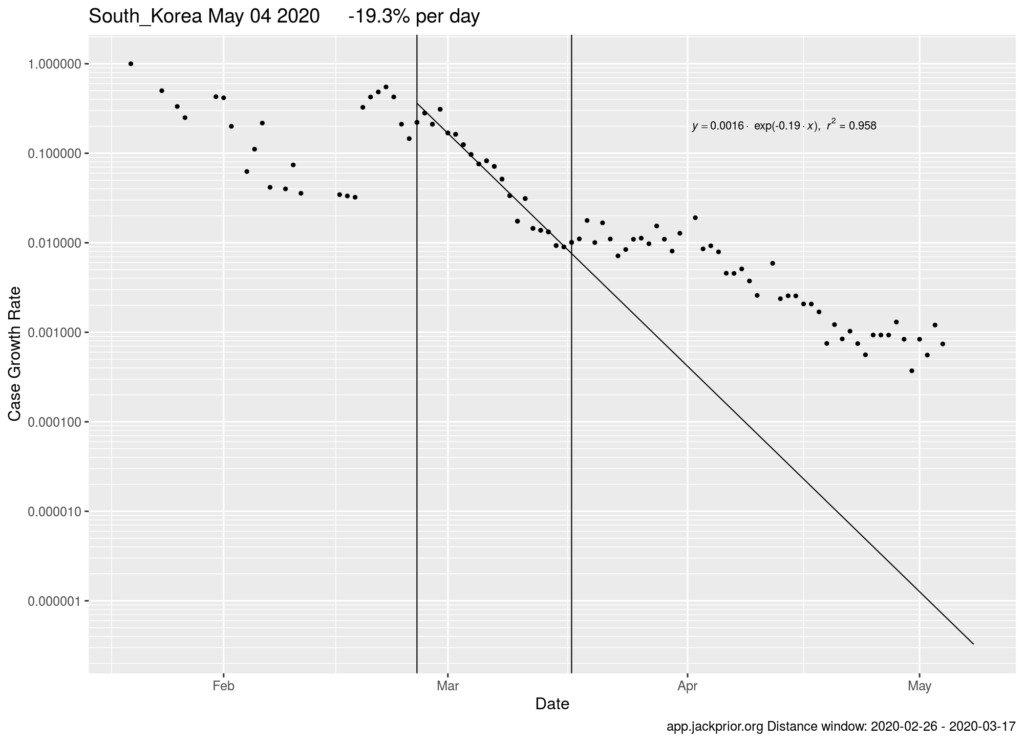
South Korea dropped its rate from 30% to 1% at a rate of -19.3% per day from February 25 to March 17th. The success of their distancing seems to have been reduced at that point.

India, which very dense living situations and a democratic government has only managed to drop its rate from 15% to 4% at a rate of -3.9% per day.

